
Bonding Curve Metrics: Reading Solana Memecoin Data Before Volume Spikes in 2026
Learn how to analyze bonding curve metrics, whale clusters, and liquidity patterns on Solana to identify potential volume shifts before price action occurs.

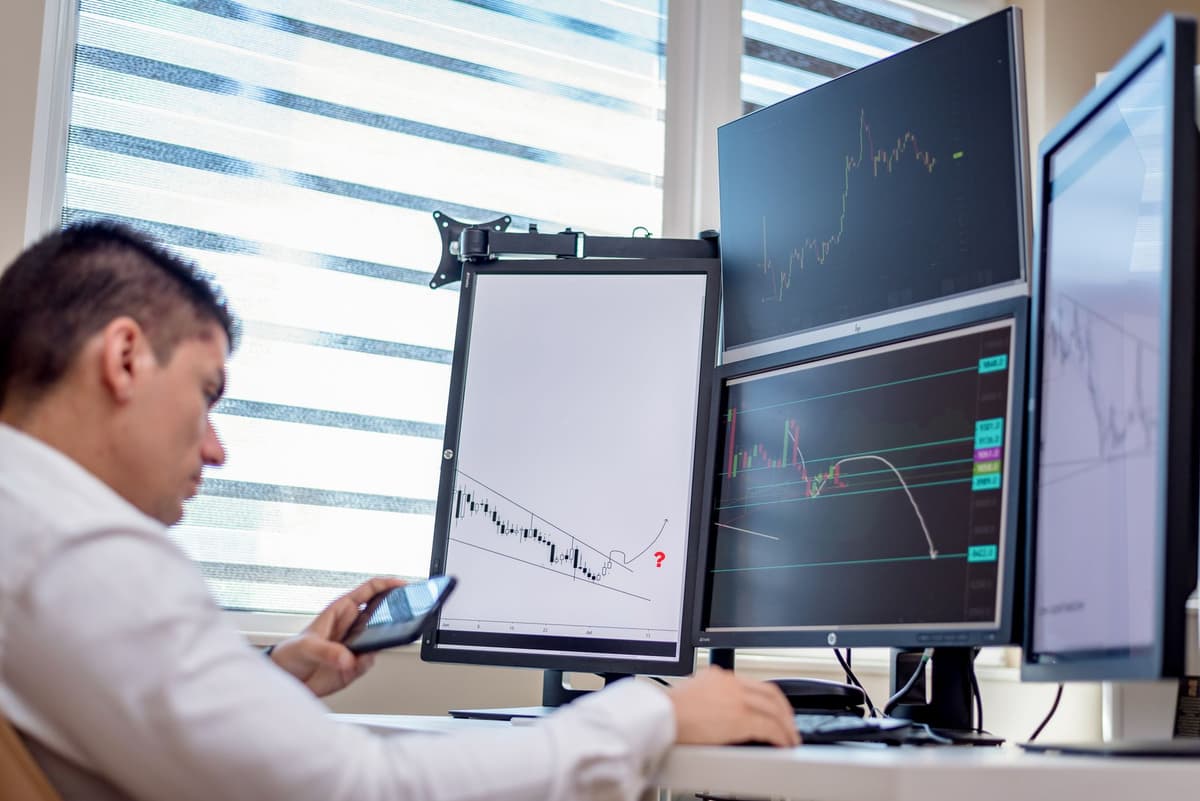
Analyzing bonding curve metrics involves tracking the velocity of buy-ins relative to the curve's progression and identifying concentration in whale wallets. By observing changes in LP distribution and significant wallet movements on-chain, market participants can better understand the momentum behind a memecoin before a major volume shift occurs.
Understanding the Bonding Curve Lifecycle
The memecoin landscape on Solana relies heavily on the bonding curve model, where the price is a function of the supply. Understanding this mathematical progression is the first step toward reading the market. A bonding curve creates a predictable relationship between the amount of SOL deposited and the tokens issued. When you see the percentage of the curve filled, you are essentially looking at the remaining "runway" before the token migrates to a decentralized exchange.
Volume spikes in 2026 are rarely random. They are usually preceded by specific on-chain behaviors that aggregate before the curve hits its threshold. Reading these symbols requires a focus on the rate of change rather than just the current price.
Key Metrics for Whale Tracking
Whale tracking is not about copying trades; it is about identifying institutional or high-net-worth liquidity shifts. When a large wallet accumulates a significant portion of a bonding curve, it often indicates an expectation of a successful migration.
Analyzing Wallet Clusters
1. Monitor the distribution of early holders
Use a block explorer to check if the top ten holders are distinct entities or if they belong to a single cluster. If a large percentage of the supply is held by a few wallets that were funded from the same source, it suggests a centralized effort which may lead to sudden liquidity dumps.
2. Track the frequency of buy-ins
Look for a steady increase in the number of unique wallets interacting with the contract. A sudden influx of small-volume buyers often precedes a larger whale entry. If the number of holders grows while the bonding curve percentage stays flat, it indicates high interest.
3. Evaluate the liquidity-to-volume ratio
Check the ratio of the token's market cap to the liquidity currently locked. If the volume begins to climb while the curve is at 60-80% completion, it often points to a "pre-migration" hype cycle where market participants are positioning for the transition to the open market.
Step-by-Step On-Chain Verification
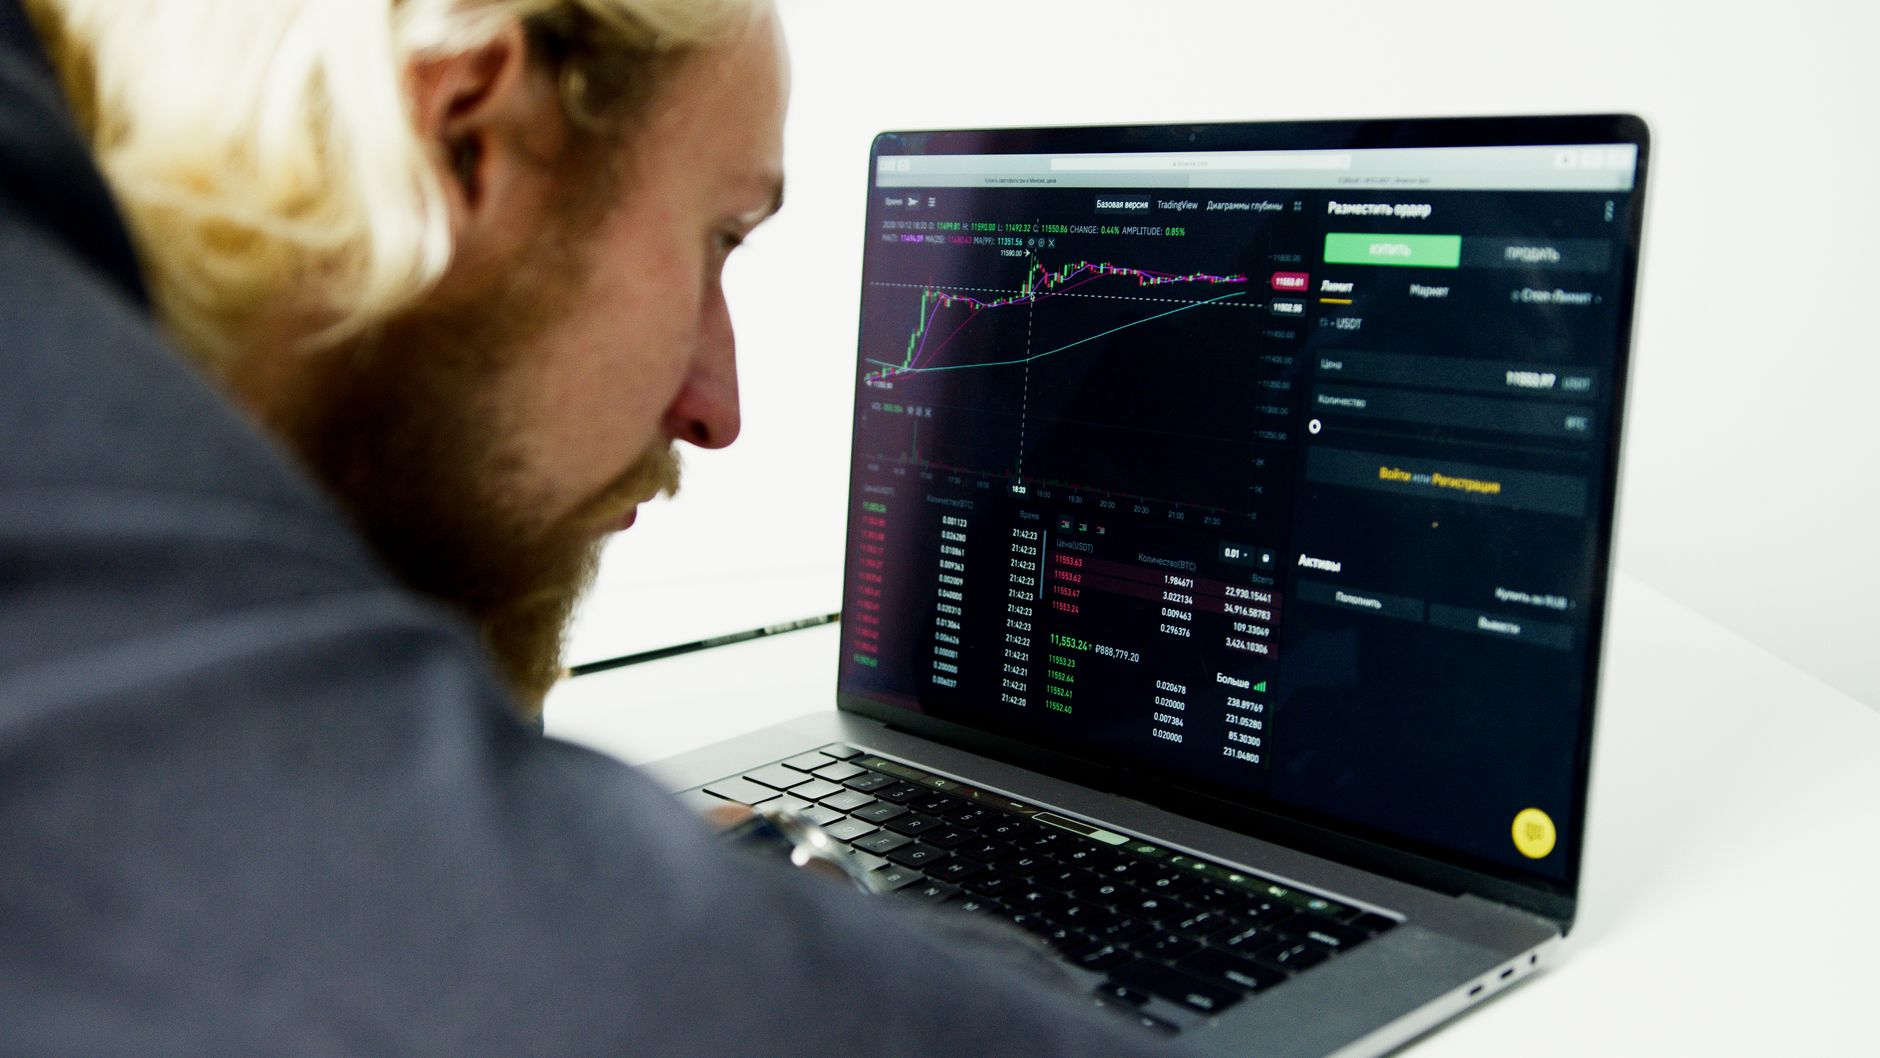
1. Identify the contract creator's history
Research the creator wallet on the explorer. Look for previous bonding curve deployments and whether those tokens successfully migrated or were abandoned. This provides context on the developer's intent.
2. Check the LP burn status
Verify if the liquidity pool tokens were burned or locked. This is a critical metric for long-term viability, as it prevents the developer from rug-pulling the liquidity after the bonding curve completes.
3. Observe the sell-pressure patterns
Watch for "wash trading" where wallets buy and sell the same amount repeatedly to create an illusion of high volume. If the volume looks organic—meaning many unique wallets are entering the token—it is a stronger signal than a few wallets moving large amounts back and forth.
Identifying Anomalous Volume
Volume is the most honest metric on the blockchain. When you see volume spikes without a corresponding increase in the number of unique holders, you are likely witnessing artificial activity. A healthy volume increase is characterized by a broadening base of holders. If you notice a spike in volume while the curve is nearing completion, evaluate whether the buying is coming from new addresses or existing whales topping off their positions.
FAQ
How can I tell if a volume spike is organic?
Organic volume is characterized by a steady growth in the number of unique holders and a diverse distribution of tokens across many wallets. If the volume spikes while the holder count remains stagnant, it is often a sign of artificial manipulation or wash trading.
What does it mean when a bonding curve reaches 90%?
At 90% completion, the token is nearing the threshold for migration to a decentralized exchange. Market participants often increase their buying activity at this stage to front-run the migration, which is why volume frequently surges just before the curve completes.
What this is NOT
This analysis is for educational purposes only. It is not financial advice, not a buy signal, and not a guarantee of profit. All memecoin trading involves high risk, and the data provided here is for informational tracking only.
Related posts in On-Chain & Whale Tracking
- On-Chain & Whale Tracking
How to Track Smart Money Wallets on Solana in 2026
Learn how to monitor high-conviction wallet activity on Solana. We break down on-chain tracking methods to identify informed capital flow and liquidity shifts.
Memelogs
- On-Chain & Whale Tracking
The 2026 Memecoin Playbook: On-Chain Verification and Whale Tracking
Master the 2026 memecoin landscape by learning to verify liquidity, analyze holder concentration, and track whale wallet clusters on the Solana network.
Memelogs
- On-Chain & Whale Tracking
Solana Whale Tracking: How to Identify and Follow Smart Money in 2026
Master on-chain analysis to track smart money on Solana. Learn how to identify profitable wallets and monitor real-time token movements without the noise.
Memelogs