
On-Chain Accumulation: Tracking Whale Behavior in the 2026 Solana Narrative
Learn how to track whale accumulation patterns on Solana using on-chain metrics. Master the art of identifying institutional interest before market trends…

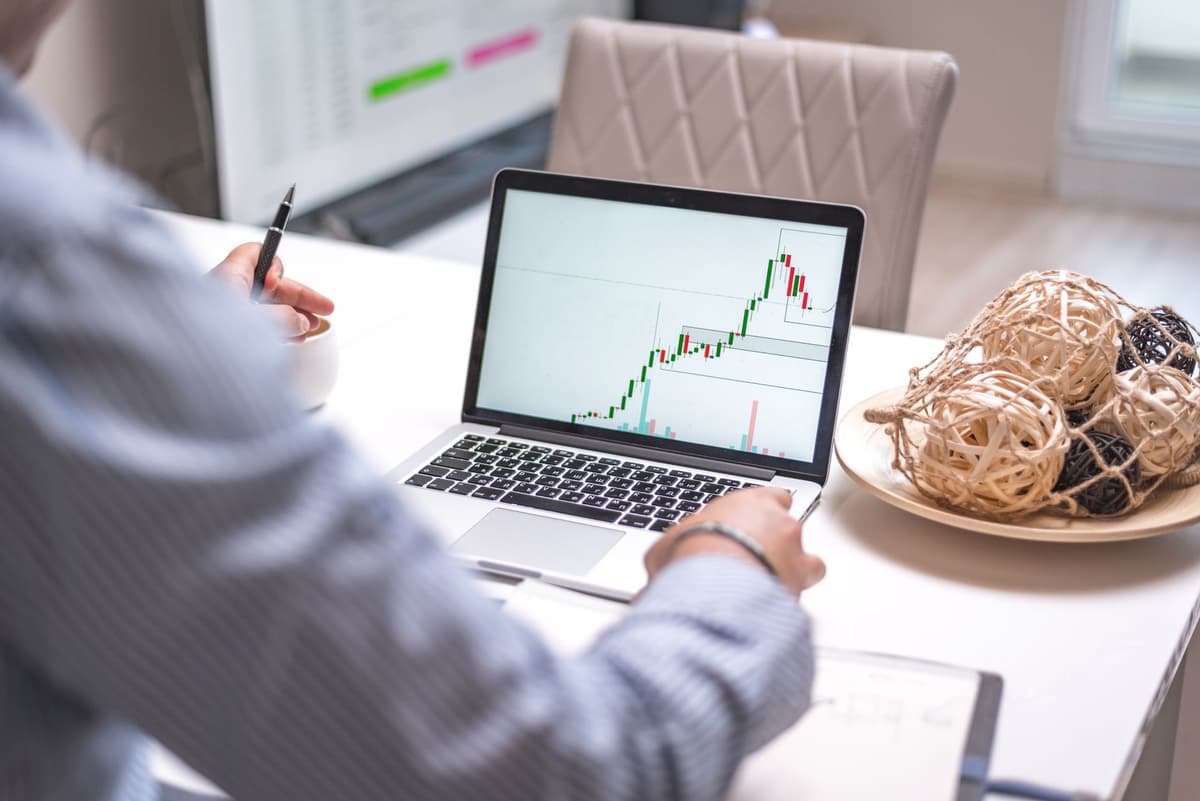
Whale accumulation is identified by observing sustained inflow into large, non-exchange addresses despite downward price pressure. In early 2026, Solana saw significant institutional positioning and high DEX volumes, signaling that sophisticated market participants were building long-term exposure during periods of high price volatility.
Understanding Whale Accumulation
Tracking "smart money" is not about guessing price movements; it is about observing where capital is flowing when the rest of the market is fearful. In the context of 2026, Solana has served as a primary case study for how institutional interest interacts with on-chain fundamentals. When large wallets continue to accumulate during a price drawdown, it often indicates a divergence between short-term market sentiment and long-term conviction.
How to Observe On-Chain Activity
To track potential accumulation, you must look beyond the price ticker. Use a block explorer to monitor the behavior of the top 100 holders of a specific asset. You are not looking for one-off buys, but rather a consistent pattern of inflows into wallets that are not associated with known centralized exchange hot wallets.
1. Filter for Non-Exchange Wallets
Exclude known CEX addresses from your analysis. If a large wallet consistently increases its balance over several weeks, it suggests a strategic position rather than a liquidity-providing maneuver.
2. Monitor DEX Volume and Fee Markets
High volume on decentralized exchanges, even during periods of price stagnation, suggests that the underlying utility of the chain remains intact. In early 2026, Solana’s fee market reforms helped reduce spam, making the on-chain data more readable and reliable for analysts.
3. Analyze NVT and Open Interest
Keep an eye on the Network Value to Transactions (NVT) ratio. A high NVT can signal that the network is being used heavily relative to its market cap. Conversely, tracking open interest in derivatives markets helps you understand whether the price action is driven by spot accumulation or speculative leverage.
The Institutional Shift
What differentiates 2026 from previous cycles is the nature of the participants. We are seeing major entities, including payment processors and global financial firms, building infrastructure on-chain. When these entities begin integrating, their activity creates a "floor" that retail-driven volatility often fails to penetrate. This is not necessarily a signal for immediate price appreciation, but it is a strong indicator of fundamental adoption.
FAQ
How can I tell the difference between accumulation and a wash trade?
Accumulation is characterized by a steady increase in wallet balances over time, often across multiple addresses that do not frequently dump back into the market. Wash trading typically involves high-frequency movement between a small cluster of wallets with no significant net change in total holdings.
Does high DEX volume always mean a trend is heating up?
Not necessarily. High volume indicates active usage, but you must cross-reference this with the type of transactions occurring. If volume is driven by utility—such as payments or protocol interactions—it is a bullish fundamental sign. If volume is driven solely by speculative trading of low-cap assets, it may simply indicate a high-risk environment.
What this is NOT
This information is for educational purposes regarding on-chain analysis techniques. It is not financial advice, not a buy signal, and not a recommendation to participate in any specific market. Always conduct your own research before interacting with any blockchain protocol.
Analyzing Market Sentiment vs.
Data
It is common to see price charts that look "bleeding" or bearish while on-chain data shows massive accumulation. This disconnect is where the most significant opportunities for observation exist. In early 2026, for example, Solana's price dropped by nearly 46% at one point, yet whale wallets continued to consolidate their positions. This behavior suggests that institutional players are often indifferent to short-term price noise, preferring to build during liquidity crunches. As a researcher, your goal is to identify these discrepancies between the "noise" of the price chart and the "signal" of the ledger.
Related posts in On-Chain & Whale Tracking
- On-Chain & Whale Tracking
Solana Liquidity Migration: Tracking Whale Patterns on DEXs in 2026
Master the art of tracking Solana liquidity migrations. Learn how to identify whale accumulation and DEX volume shifts using on-chain data analysis.
Memelogs
- On-Chain & Whale Tracking
On-Chain Accumulation Patterns: Tracking Whale Behavior in 2026
Learn how to track whale accumulation patterns on-chain. Identify institutional-grade movement and fresh wallet behavior before market narratives shift.
Memelogs
- On-Chain & Whale Tracking
Solana On-Chain Red Flags: How to Spot Whale Manipulation in 2026
Master the art of reading Solana on-chain data. Learn to identify whale accumulation, liquidity risks, and wallet clusters in new token launches safely.
Memelogs