
Reading Bonding Curve Metrics: Analyzing Memecoin On-Chain Activity in 2026
Master the art of reading bonding curve metrics on Solana. Learn to analyze wallet clusters, liquidity, and volume to make informed on-chain decisions.

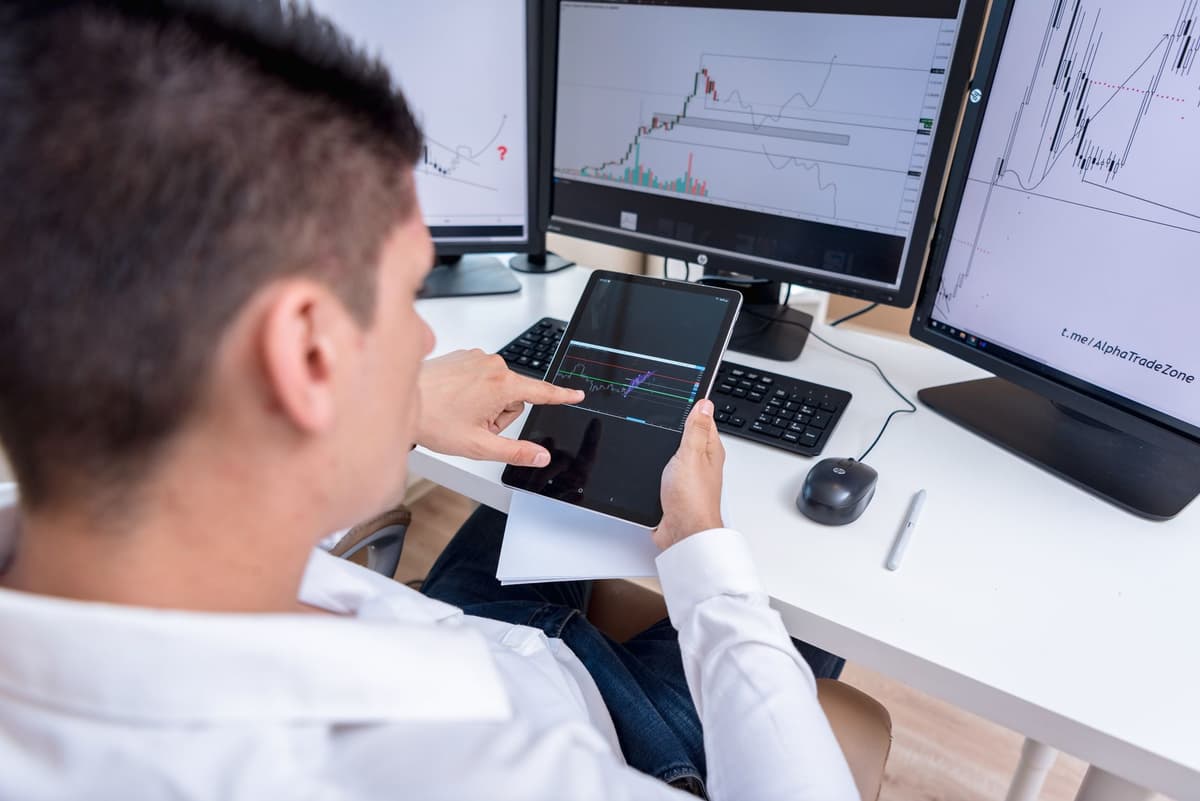
Reading bonding curve metrics involves tracking the real-time ratio of token supply to liquidity pool reserves to identify genuine market interest versus artificial inflation. By monitoring wallet clusters and migration progress, participants can distinguish between organic activity and potential manipulation before a token hits a decentralized exchange.
In 2026, the Solana ecosystem remains the primary hub for memecoin activity, characterized by high liquidity and rapid deployment cycles. Understanding how to interpret the raw on-chain data behind these curves is essential for any market participant looking to navigate the current landscape with a technical perspective.
The Anatomy of a Bonding Curve
The bonding curve is essentially a mathematical model that dictates the price of a token based on its supply. As more participants buy into the token, the price increases along a predefined curve. When the bonding curve reaches its capacity, the remaining liquidity is typically migrated to a decentralized exchange.
Analyzing this phase is not about predicting price action, but about understanding the health of the token's distribution. A healthy curve often displays consistent, smaller buy orders rather than a single massive wallet sweeping the supply.
Step-by-Step On-Chain Analysis
1. Analyze the Holder Distribution
Use an explorer to look at the top holders. If a single wallet or a small cluster of wallets holds a significant percentage of the supply, the token is highly susceptible to sudden liquidity drains.
2. Monitor Liquidity Real-Time
Check the bonding curve progress bar to see how close the token is to migration. If the liquidity pool is growing incrementally, it suggests a broader base of participants. If it jumps in large, irregular spikes, investigate the transaction history to identify if these are whale movements.
3. Evaluate Buy-to-Sell Ratios
Look at the recent transaction logs. A healthy token typically shows a steady stream of buy orders. If you observe a high frequency of sell orders relative to buys, the bonding curve is likely losing momentum, regardless of the price shown on the interface.
4. Track Migration Readiness
Once the bonding curve is near completion, monitor the contract for the migration event. Ensure that the liquidity is being locked or burned according to the platform standards to avoid immediate volatility upon exchange listing.
| Metric | Indicator of Stability | Warning Sign |
|---|---|---|
| Top Holder % | Under 10% concentration | Over 25% in one wallet |
| Transaction Flow | Consistent, small buys | Large, sporadic dumps |
| Liquidity Growth | Steady, gradual increase | Instant, massive spikes |
Understanding Whale Behavior
In 2026, whale movement on Solana is highly transparent. By tracking the flow of SOL, you can see if large wallets are accumulating or distributing. If a wallet that historically participates in early-stage launches is selling, it is a data point, not a signal. Always look for patterns across multiple wallets rather than reacting to a single transaction.

High volume is a double-edged sword. It indicates interest, but it can also mask predatory behavior. Always cross-reference high volume with the number of unique active wallets to ensure the interest is diverse and not just wash-trading between controlled accounts.
FAQ
What is the most important metric to check before a migration?
The most critical metric is the percentage of supply held by the top ten wallets. If this concentration is too high, the risk of a massive sell-off immediately following the bonding curve migration is significantly increased.
Does high volume always mean a project is legitimate?
No. High volume can be generated by automated scripts or wash-trading. Always verify the volume by checking the number of unique wallet addresses interacting with the bonding curve to confirm genuine participation.
What this is NOT
This information is provided for educational purposes only and does not constitute financial advice, an investment recommendation, or a signal to buy any specific token. Memecoin trading involves high risk and potential for total loss. Always conduct your own research.
Related posts in On-Chain & Whale Tracking
- On-Chain & Whale Tracking
Tracking Whale Wallets in 2026: A Blueprint for On-Chain Intelligence
Learn how to monitor large wallet movements and identify smart money patterns without relying on blind copy-trading strategies in the evolving crypto market.
Memelogs
- On-Chain & Whale Tracking
Solana Liquidity Migration: Tracking Capital Shifts in 2026
Master the art of tracking on-chain liquidity shifts on Solana. Learn how to monitor whale movements and protocol migrations to stay ahead in 2026.
Memelogs
- On-Chain & Whale Tracking
Tracking Smart Money Wallets on Solana for 2026: An On-Chain Workflow
Master the art of tracking smart money on Solana. Learn how to identify high-signal wallets, monitor liquidity shifts, and analyze on-chain data flows.
Memelogs