
Reading Bonding Curve Metrics: A 2026 Guide to On-Chain Memecoin Analysis
Master the art of reading bonding curve metrics in 2026. Learn how to track liquidity, holder distribution, and volume to make informed on-chain decisions.

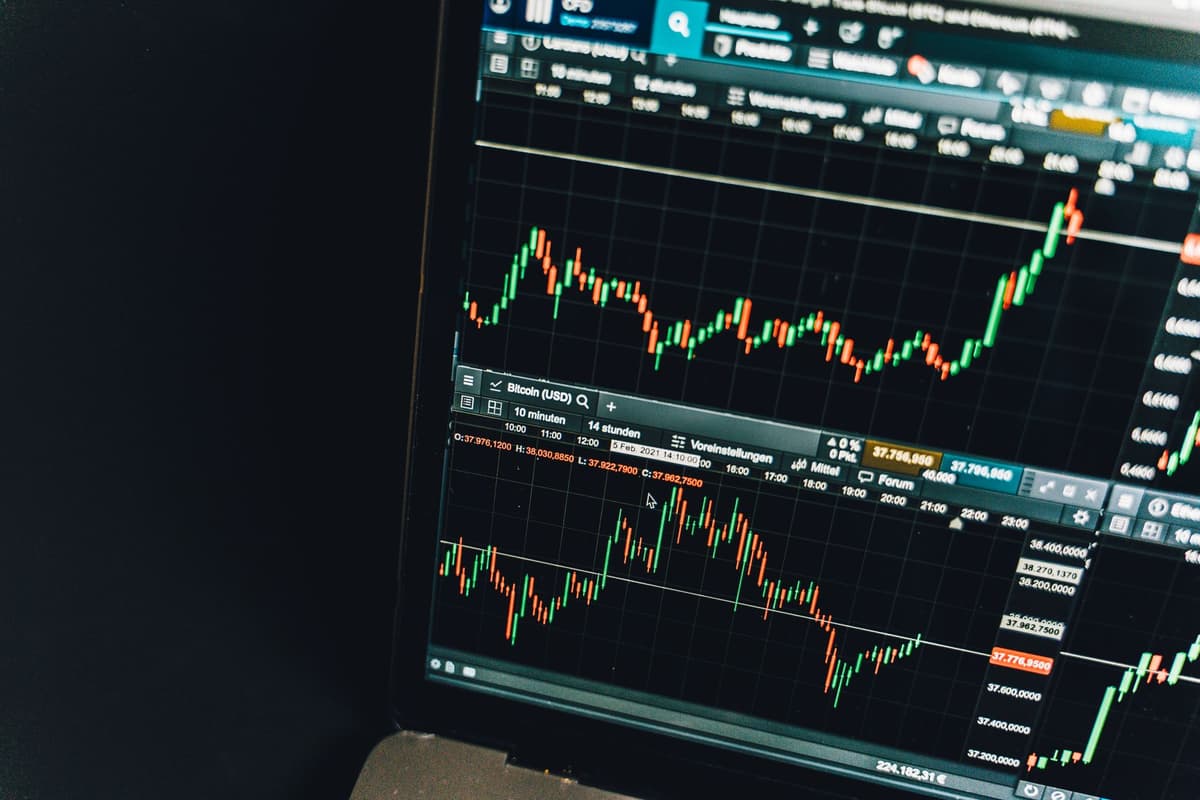
Bonding curve metrics provide a real-time mathematical representation of a token's price progression based on supply demand. By monitoring liquidity depth and the rate of token graduation, market participants can identify the technical health of a memecoin before it migrates to a decentralized exchange.
Understanding the Bonding Curve
A bonding curve is a deterministic pricing mechanism that removes the need for traditional order books during the early stages of a token's lifecycle. Instead of matching a buyer with a seller, the smart contract acts as the counterparty, adjusting the price automatically based on the volume of tokens minted or burned.
As participants purchase tokens, the supply increases and the price climbs according to a pre-defined formula. Conversely, selling decreases the supply and lowers the price. In 2026, understanding this curve is essential for distinguishing between organic momentum and artificial price manipulation.
Essential Metrics for On-Chain Analysis
To effectively navigate these markets, you must look beyond the price chart. The following metrics provide a clearer picture of a token's current state and its trajectory toward graduation.
1. Liquidity Quality
Check the total liquidity pool relative to the current market capitalization. High liquidity relative to the market cap suggests a more stable curve, while low liquidity often leads to extreme volatility during even minor sell-offs. Verify that the liquidity is locked or burned to ensure the project cannot be drained.
2. Holder Concentration
Use a block explorer to inspect the top token holders. If the top ten wallets control a significant percentage of the supply, the token is at high risk of a coordinated dump. Look for a healthy distribution where no single entity holds a majority, which indicates a more decentralized community.
3. Real-Time Volume
Volume is the engine of the bonding curve. Monitor the 24-hour trading volume to ensure there is sufficient interest to move the token along the curve. Stagnant volume in a rising market is often a warning sign of an exhausted trend.
4. Graduation Thresholds
Most launchpads require a token to reach a specific market cap or liquidity target before it graduates to a standard decentralized exchange. Track how close the current market cap is to this threshold. Tokens nearing graduation often see increased speculative activity.
| Metric | Indicator of Health | Warning Sign |
|---|---|---|
| Liquidity | Increasing & Locked | Low, Unlocked, or Drained |
| Holder Dist. | Broadly Distributed | Top 5 Wallets > 30% |
| Volume | Consistent Growth | Spike followed by flatline |
Practical Analysis Workflow
- Identify the token's current position on the curve using a block explorer or a standardized data aggregator.
- Review the contract source code for any unusual minting functions or ownership privileges.
- Analyze the recent transaction history to identify if a single wallet cluster is responsible for the majority of the volume.
- Compare the current market cap against the platform's migration requirements to gauge the remaining distance to graduation.
FAQ
What is the primary risk when trading tokens on a bonding curve?
The primary risk is the deterministic nature of the price, which can lead to rapid devaluation if liquidity is thin. Because the contract acts as the sole counterparty, large sell orders directly impact the price without requiring a matching buyer.
Can I predict when a memecoin will move to a decentralized exchange?
You cannot predict it with certainty, but you can monitor the progress toward the graduation threshold. By tracking the market cap and liquidity targets set by the launchpad, you can identify when a token is mathematically prepared for migration.
Final Notes
What this is NOT: This is not financial advice, nor is it a buy signal for any specific asset. Memecoin trading involves extreme risk of capital loss. Always perform your own due diligence and never rely solely on automated metrics without verifying the underlying on-chain data.
Related posts in On-Chain & Whale Tracking
- On-Chain & Whale Tracking
On-Chain Accumulation Patterns: Tracking Whale Behavior in the 2026 Solana Market
Learn how to track whale wallet accumulation on Solana. Discover the on-chain metrics for identifying early narrative shifts before market-wide volatility hits.
Memelogs
- On-Chain & Whale Tracking
Decoding Bonding Curve Metrics: A 2026 Guide for On-Chain Analysis
Master the art of reading bonding curve metrics to identify momentum in Solana memecoins. Learn to analyze liquidity, holder distribution, and on-chain flow.
Memelogs
- On-Chain & Whale Tracking
Decoding Bonding Curve Metrics for Solana Memecoin Momentum in 2026
Master the art of reading on-chain bonding curve metrics. Learn to analyze liquidity, holder distribution, and volume to spot early-stage memecoin activity.