
On-Chain Accumulation Patterns: Tracking Whale Behavior in the 2026 Solana Market
Learn how to track whale wallet accumulation on Solana. Discover the on-chain metrics for identifying early narrative shifts before market-wide volatility hits.

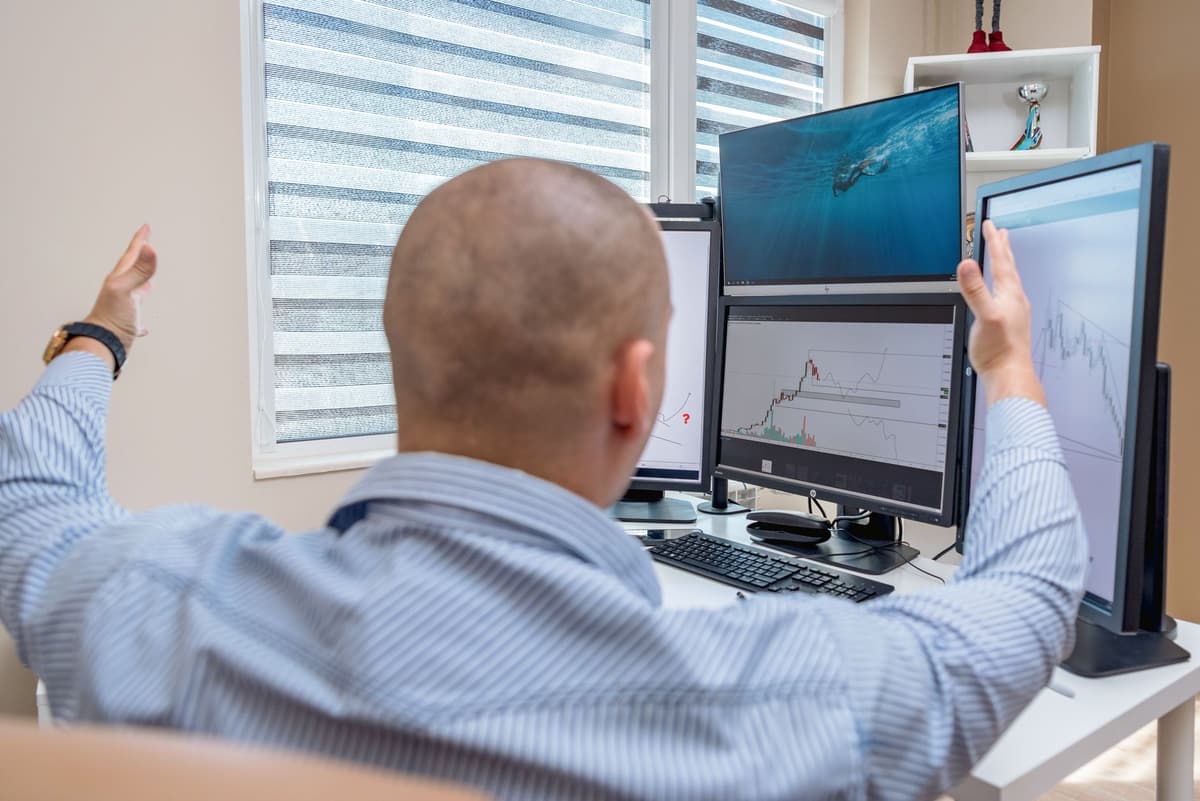
Whale accumulation in early 2026 is identified by tracking net inflows into specific wallet clusters that consistently stack assets during periods of price consolidation. By monitoring on-chain transaction logs for large, recurring SOL purchases and stablecoin rotations into liquidity pools, market participants can detect early-stage interest before broader retail sentiment shifts.
Understanding the Whale Accumulation Signal
As 2026 begins, the crypto landscape is defined by a resurgence in large-holder activity. With Solana DEX volume reaching significant milestones in the previous year, the current market environment has shifted toward a focus on long-term positioning rather than high-frequency flip cycles. Whales are currently demonstrating a preference for accumulating SOL despite price fluctuations, a behavior often correlated with institutional-grade confidence in network utility.
Tracking this behavior requires moving beyond simple price charts. Instead, it involves analyzing the movement of capital from dormant addresses to active liquidity providers. When large wallets—often categorized as those holding substantial amounts of SOL—begin to increase their positions, it serves as a macro-signal for the broader ecosystem health.
How to Track Accumulation: A Technical Approach
To observe these trends, one must utilize public explorers to filter through raw transaction data. This process is not about finding a specific token to buy, but about understanding where capital is flowing.

1. Monitor Wallet Clusters
Use an explorer to identify clusters of wallets that interact with the same smart contracts. You are looking for addresses that have historically held large balances and have recently increased their net SOL holdings over a 30-day period.
2. Analyze Liquidity Provider (LP) Activity
Check the LP positions of trending tokens. If you observe large, non-retail liquidity injections, this often indicates that sophisticated participants are preparing for increased volume. Look for consistency in these deposits rather than singular, massive spikes.
3. Evaluate Holding Duration
Filter for wallets that have held their assets for longer than the average retail participant. A wallet that consistently buys and rarely sells during volatility is a primary indicator of long-term accumulation sentiment.
4. Review Net Flow Metrics
Calculate the net difference between inflows and outflows for the top 50 holders of a given asset. A positive net flow, even during price consolidation, suggests that large holders are absorbing the supply being sold by retail.
Data Points to Watch
| Metric | Significance |
|---|---|
| Net Inflow | Indicates whether whales are buying or offloading |
| LP Depth | Measures the capacity of the market to absorb large trades |
| Wallet Age | Older wallets accumulating suggest long-term conviction |
| Transaction Frequency | High-frequency small buys suggest bot accumulation; low-frequency large buys suggest human whale activity |
What this is NOT
This analysis is for educational purposes only and does not constitute financial advice. It is not a buy signal, nor does it guarantee future market performance. On-chain data reflects past and current activity but cannot predict market outcomes or protect against volatility.
FAQ
Does whale accumulation guarantee a price increase?
No. While whale accumulation often signals institutional confidence, it does not guarantee price appreciation. Whales may be hedging, providing liquidity for yield, or accumulating for reasons unrelated to immediate short-term price action.
How can I distinguish between a whale and a liquidity bot?
Human whale activity is typically characterized by larger, less frequent transactions and a focus on long-term holding. Liquidity bots often execute thousands of small, rapid-fire transactions to manage spread and capture arbitrage opportunities, which can be identified by high transaction frequency and interaction with specialized automated market maker contracts.
Related posts in On-Chain & Whale Tracking
- On-Chain & Whale Tracking
Reading Bonding Curve Metrics: A 2026 Guide to On-Chain Memecoin Analysis
Master the art of reading bonding curve metrics in 2026. Learn how to track liquidity, holder distribution, and volume to make informed on-chain decisions.
Memelogs
- On-Chain & Whale Tracking
Decoding Bonding Curve Metrics: A 2026 Guide for On-Chain Analysis
Master the art of reading bonding curve metrics to identify momentum in Solana memecoins. Learn to analyze liquidity, holder distribution, and on-chain flow.
Memelogs
- On-Chain & Whale Tracking
Decoding Bonding Curve Metrics for Solana Memecoin Momentum in 2026
Master the art of reading on-chain bonding curve metrics. Learn to analyze liquidity, holder distribution, and volume to spot early-stage memecoin activity.
Memelogs