
Bonding Curve Metrics: Reading Solana Memecoin Trends in 2026
Master bonding curve mechanics to track whale accumulation and price discovery. Learn how to analyze on-chain data before memecoin breakouts occur.

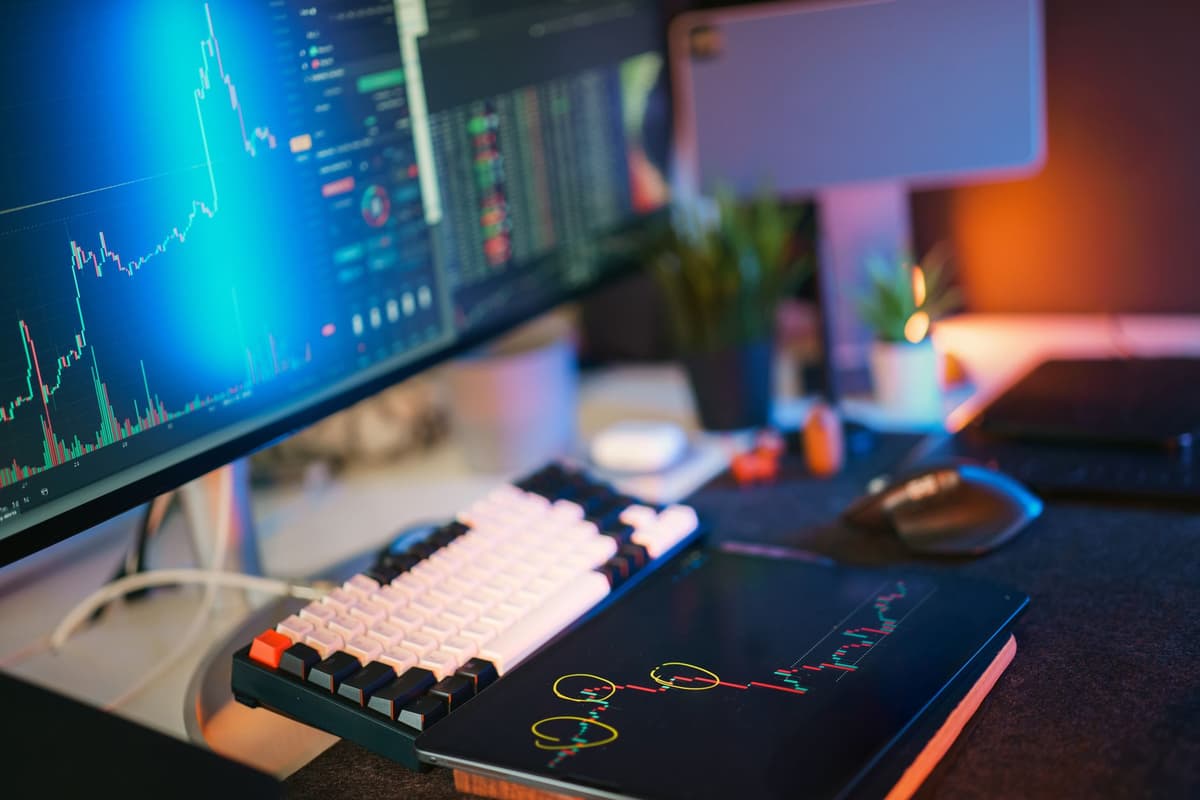
Bonding curves function as automated price discovery mechanisms where token value increases proportionally with supply growth. Market participants can identify potential breakouts by monitoring wallet clustering, sustained volume shifts, and the transition of liquidity from the bonding phase to decentralized exchanges.
Understanding the Bonding Curve Mechanic
In the current Solana ecosystem, memecoins often bypass traditional order books at inception. Instead, they utilize a bonding curve—a smart contract that dictates price based on a mathematical formula. As liquidity flows into the contract, the token moves up the curve, increasing the price for subsequent buyers. This creates a predictable, albeit high-risk, environment for early-stage asset discovery.
Understanding this phase is crucial because it represents the "price discovery" period. Unlike established tokens with deep liquidity, bonding curve assets are highly sensitive to initial capital inflows. When a whale or a cluster of smart money enters during this phase, the upward pressure on the bonding curve is immediate and visible on-chain.
How to Analyze On-Chain Accumulation
1. Monitor Wallet Clusters
Use a block explorer to inspect the top holders. Look for wallets that funded their positions from centralized exchanges shortly before the token launch. High concentration in a few wallets suggests that early actors are positioning for the bonding curve completion.
2. Track Volume Persistence
Analyze the transaction frequency. A single massive buy is less significant than a steady stream of medium-sized buys. Sustained volume indicates that the asset is gaining organic interest rather than being subject to a single-event pump.
3. Evaluate Price Levels
Observe how the price interacts with psychological thresholds. For instance, if an asset shows support at a specific price point, such as 0.1482, and resists dropping below it despite market volatility, it may suggest that large holders are defending their positions or that the floor is solidifying.
4. Observe Migration Readiness
Most bonding curve platforms have a threshold for when the token graduates to a standard liquidity pool. Monitor the percentage of the curve completed. As the pool approaches full capacity, volatility often increases as traders anticipate the transition to a decentralized exchange environment.
Mitigating Risks in Early-Stage Assets
Recent developments in the Solana ecosystem have introduced mechanisms to protect participants from immediate post-launch failures. Some newer platforms now implement lockup periods or exit protection features, which allow initial participants to reclaim principal if specific conditions are met. This is a significant evolution from the "wild west" era of memecoin trading, as it forces a degree of accountability on the initial liquidity phase.
FAQ
What is the significance of the bonding curve completion?
Once the bonding curve is fully funded, the protocol typically migrates the liquidity to a decentralized exchange. This is the moment when the price is no longer governed by the contract formula but by market-driven supply and demand, often leading to increased price discovery and volatility.
How can I identify if a whale is accumulating?
Look for a series of consistent, non-overlapping buy transactions from wallets that share common funding sources. If these buys occur at rising price intervals on the curve, it indicates an intentional accumulation strategy rather than reactive retail trading.
What this is NOT
This content is not financial advice, nor is it a solicitation to purchase any digital asset. All data shared regarding specific price levels or whale activity is for educational purposes regarding on-chain analysis and does not constitute a buy signal.
Related posts in On-Chain & Whale Tracking
- On-Chain & Whale Tracking
Solana Whale Tracking: Identifying Liquidity Migration Patterns in 2026
Learn how to monitor Solana DEX liquidity migration and whale wallet movements using on-chain analytics to understand market shifts without the hype.
Memelogs
- On-Chain & Whale Tracking
Decoding Bonding Curve Metrics: A Guide to Solana Memecoin Analysis in 2026
Master the art of reading on-chain bonding curve metrics on Solana. Learn to evaluate liquidity, whale activity, and market progress before the next move.
Memelogs
- On-Chain & Whale Tracking
Tracking Smart Money Wallets on Solana: A 2026 On-Chain Strategy
Master the art of tracking smart money on Solana. Learn to identify profitable wallets, monitor liquidity, and decode on-chain behavior for better insights.
Memelogs