
Decoding Bonding Curve Metrics: A Guide to Solana Memecoin Analysis in 2026
Master the art of reading on-chain bonding curve metrics on Solana. Learn to evaluate liquidity, whale activity, and market progress before the next move.

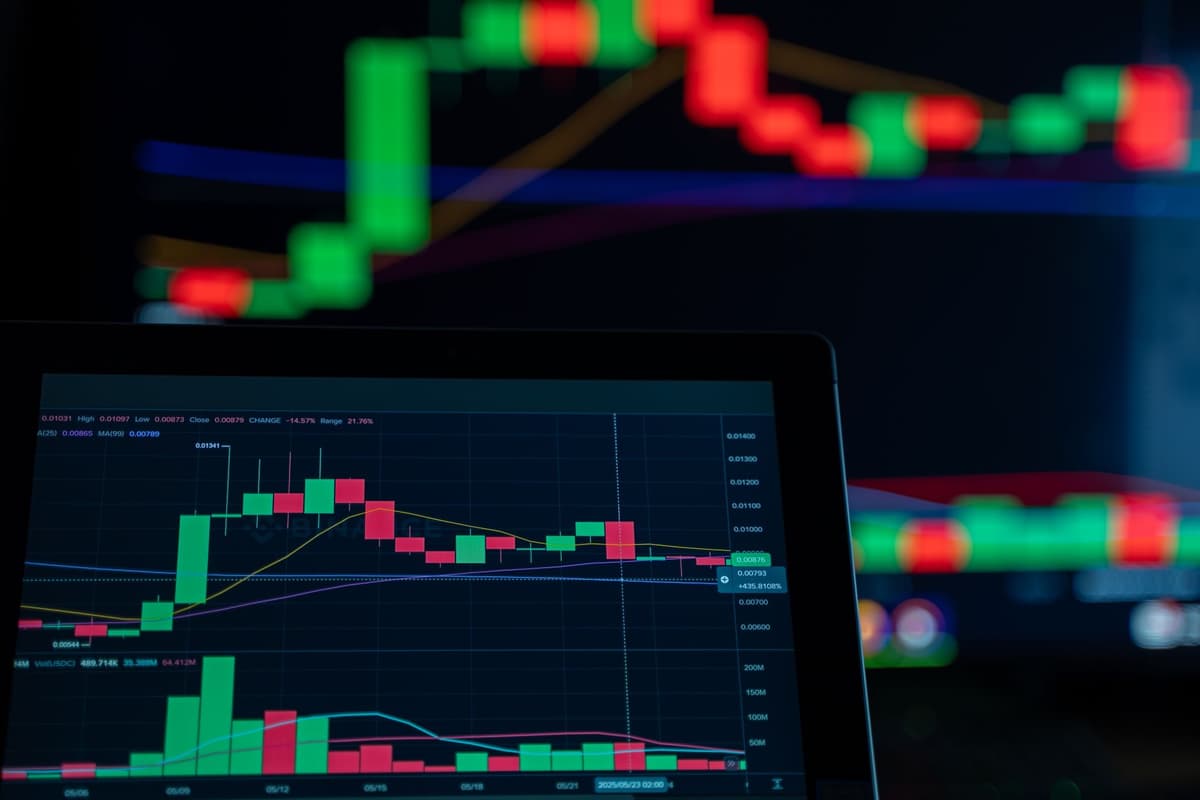
Bonding curve metrics provide a real-time snapshot of a token's progression toward a decentralized exchange launch. By monitoring the percentage of SOL raised versus the remaining supply, participants can determine the token's current phase and identify potential risks related to liquidity and early-stage distribution.
Understanding the Bonding Curve Lifecycle
In the current Solana landscape, the bonding curve acts as the primary mechanism for price discovery during a token's inception. Unlike traditional order books, a bonding curve uses a mathematical formula to determine the price based on the amount of SOL deposited into the smart contract. As more SOL is added to the pool, the price increases until the curve reaches its limit, triggering a migration to a decentralized exchange.
The Importance of Liquidity
Liquidity is the bedrock of any tradable asset. Without sufficient liquidity, even minor transactions can cause extreme price volatility, making it nearly impossible for market participants to enter or exit positions effectively. Before engaging with any memecoin, it is critical to verify the health of the liquidity pool.
1. Analyze Liquidity Lock Status
A liquidity lock is a protective measure that prevents developers from withdrawing the pool's funds. Always confirm that the LP tokens are burned or locked in a verifiable contract.
2. Verify Ownership
Check the contract ownership status to ensure that the liquidity pool is not controlled by a single entity capable of draining the funds.
3. Monitor Volume Trends
High trading volume is a double-edged sword. While it indicates interest, it can also signal bot activity or wash trading. Compare the volume against the current market cap to identify organic momentum.
Step-by-Step On-Chain Evaluation
To assess a token before a significant market cap shift, follow these objective checks using a block explorer.
- Check the bonding curve progress percentage to see how much SOL has been raised versus the total required.
- Review the wallet distribution list to identify if a single wallet or a cluster holds a significant percentage of the supply.
- Verify if the liquidity provider tokens have been burned or permanently locked.
- Analyze the transaction history for large sell-offs that might indicate early holders taking profits ahead of the migration.
- Compare the token's current market cap against the historical performance of similar bonding curve projects.
Key Metrics Table
| Metric | Purpose | Importance |
| - | - | - |
| Raised SOL | Tracks curve progress | High |
| LP Lock | Prevents rug-pulls | Critical |
| Holder Count | Measures distribution | Medium |
| 24h Volume | Gauges market interest | High |
FAQ
What is the primary risk of a bonding curve token?
The primary risk is the potential for a lack of liquidity or a rug-pull if the developer retains control over the liquidity pool. Always verify that LP tokens are burned.

How can I identify whale movement in a memecoin?
Use an on-chain explorer to observe wallet clusters. If a few wallets hold a large percentage of the supply and start moving tokens to exchange addresses, it may indicate impending downward pressure.
What this is NOT
This content is not financial advice, nor is it a buy signal for any specific token. All market participation in the memecoin sector carries a high risk of capital loss. Always conduct your own research and verify all on-chain data independently before making any decisions.
Market Context 2026
As Solana's Total Value Locked hits record highs, the activity surrounding memecoins remains a focal point for the ecosystem. Whether observing established tokens like Bonk or emerging bonding curve projects, the fundamentals of on-chain analysis remain the same: liquidity, distribution, and transparency are the only reliable indicators in a high-stress, high-volatility environment.
Related posts in On-Chain & Whale Tracking
- On-Chain & Whale Tracking
Solana Whale Tracking: Identifying Liquidity Migration Patterns in 2026
Learn how to monitor Solana DEX liquidity migration and whale wallet movements using on-chain analytics to understand market shifts without the hype.
Memelogs
- On-Chain & Whale Tracking
Tracking Smart Money Wallets on Solana: A 2026 On-Chain Strategy
Master the art of tracking smart money on Solana. Learn to identify profitable wallets, monitor liquidity, and decode on-chain behavior for better insights.
Memelogs
- On-Chain & Whale Tracking
Bonding Curve Metrics: Reading Solana Memecoin Trends in 2026
Master bonding curve mechanics to track whale accumulation and price discovery. Learn how to analyze on-chain data before memecoin breakouts occur.
Memelogs