
Decoding Bonding Curve Metrics: Analyzing Solana Memecoin Launches in 2026
Master the art of reading on-chain bonding curve metrics. Learn how to verify liquidity, track whale distribution, and identify token health before you trade.

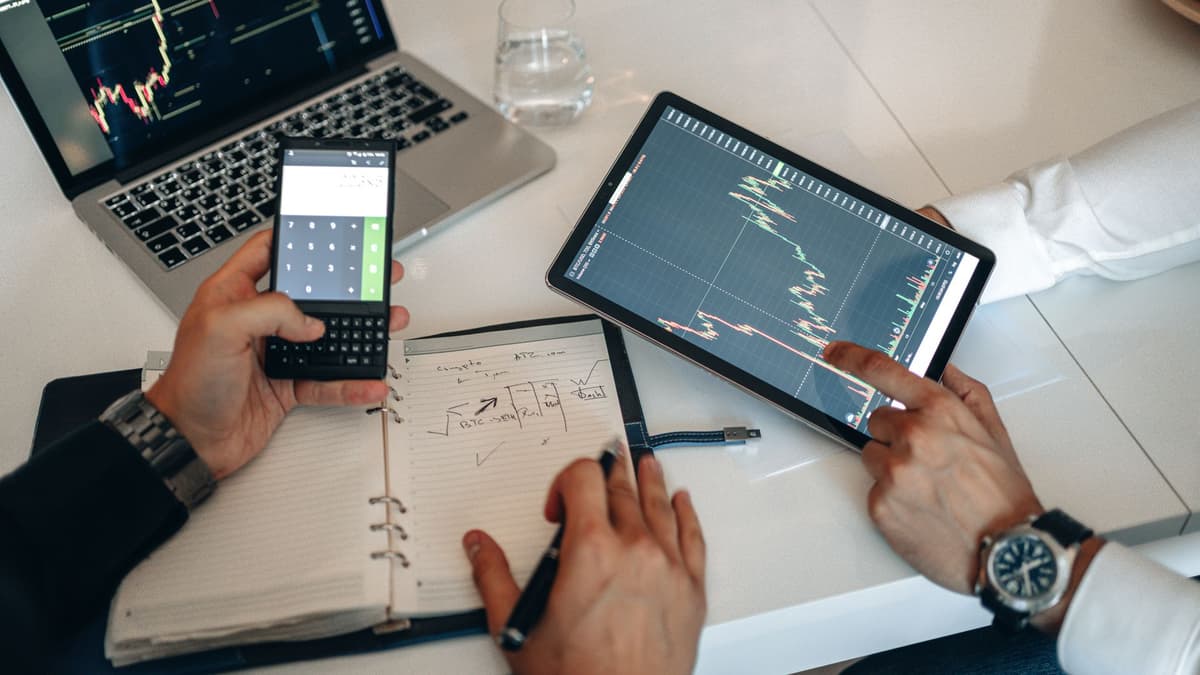
To analyze a bonding curve effectively, focus on the ratio of initial liquidity to total supply and the distribution of token holders. By checking for burned or locked liquidity and identifying concentrated wallet clusters, you can determine if a token is a viable market movement or a high-risk launch. This is not financial advice and not a buy signal.
Understanding the Bonding Curve Framework
In 2026, the Solana ecosystem has evolved, but the underlying mechanics of bonding curves remain the primary gateway for new token launches. Unlike traditional order-book markets, bonding curve tokens rely on automated liquidity pools that dictate price based on the supply circulating within the curve. Understanding these metrics is essential for any market participant aiming to filter out noise.
Core Metrics for Evaluation
Before engaging with a new token, you must verify the integrity of the contract. The following table outlines the foundational checks required for every on-chain analysis:
| Metric | Purpose | Threshold for Caution |
|---|---|---|
| Liquidity Lock | Ensures funds cannot be pulled | Unlocked or low-percentage lock |
| Holder Concentration | Detects whale dominance | Top 10 wallets holding >30% |
| Bonding Curve Progress | Tracks market saturation | Approaching 100% capacity |
1. Verifying Liquidity Status
Always start by confirming the status of the liquidity pool. On Solana, look for evidence that liquidity has been burned or permanently locked in a contract. If the liquidity is not locked, the risk of a sudden withdrawal by the deployer is significantly higher. Use a block explorer to check the transaction history of the token creator to see if they have moved funds to a decentralized exchange.
2. Analyzing Holder Distribution
High concentration is the most common signal of future volatility. If you observe that a small number of wallets hold a significant portion of the total supply, be aware that these entities can manipulate the price at will. Use an explorer to view the 'Top Holders' list. If the top 10 wallets are linked to the same cluster or were funded by the same origin address, this indicates a high likelihood of coordinated selling.
3. Tracking Whale Accumulation
Whale activity is a key trend in 2026. Large wallets often accumulate tokens in stages. Monitor the movement of large balances entering the token contract. If you see consistent, small-to-medium buys from diverse, unrelated wallets, this often signals organic interest. Conversely, large, single-transaction buys followed by immediate inactivity can be a sign of a pump-and-dump structure.
4. Monitoring Volume and Migration
Because traditional volume metrics can be misleading on bonding curves, focus on the volume generated on the specific launchpad hosting the token. As the token approaches the migration point—where it moves from the bonding curve to a decentralized exchange—volume usually spikes. Watch for this transition, as it represents the point of maximum liquidity and price discovery.
FAQ
What is the most critical red flag in a bonding curve launch?
The most critical red flag is a lack of locked or burned liquidity. Without a verifiable lock, the deployer retains the ability to remove all liquidity, rendering the token worthless instantaneously. Always verify the lock address on a reliable block explorer.

Does whale accumulation guarantee a price increase?
No. While whale accumulation is a trend observed in 2026 as a signal of long-term confidence in the broader Solana ecosystem, it does not guarantee price appreciation for specific memecoins. Whales often use smaller tokens to test market sentiment or as part of a complex hedging strategy. Always perform your own due diligence rather than following large wallets blindly.
Maintaining Market Vigilance
Trading in the memecoin jungle requires a disciplined approach to data. Do not rely on social media sentiment or hype cycles. Instead, keep your eyes on the ledger. By consistently applying these on-chain checks, you can navigate the volatility of 2026 with a clearer understanding of the risks involved. Remember, every on-chain interaction is permanent; verify the contract, check the liquidity, and assess the holder distribution before taking any action.
Related posts in On-Chain & Whale Tracking
- On-Chain & Whale Tracking
Solana Liquidity Migration: Tracking On-Chain Shifts in 2026
Master the art of tracking Solana liquidity migration. Learn to identify whale patterns and DEX shifts to navigate the 2026 on-chain landscape effectively.
Memelogs
- On-Chain & Whale Tracking
How to Track Smart Money Wallets on Solana for 2026 Market Analysis
Master on-chain analysis to identify professional wallet activity on Solana. Learn how to track liquidity, whale movements, and smart money patterns.
Memelogs
- On-Chain & Whale Tracking
Memecoin Token Playbook 2026: Analyzing Wallets, LP, and Concentration
Master the art of on-chain analysis in 2026. Learn to verify liquidity, track holder concentration, and assess wallet security before engaging with tokens.
Memelogs