
Narrative Heat Map: Solana Sentiment vs. On-Chain Reality in 2026
Analyzing the widening gap between Solana's bearish social sentiment and its record-breaking on-chain performance. Stay sharp as the narrative shifts.


Solana's current narrative heat map shows a stark divergence: social media sentiment has hit a 2026 bearish extreme while on-chain metrics reach historical highs. This disconnect indicates that while retail participants are currently fearful, the underlying network utility remains robust, creating a high-tension environment for market participants.
Today's Narrative Heat Map: The Sentiment Gap
The dominant narrative circulating on timelines today is one of exhaustion. Following a prolonged period of price pressure, the social sentiment surrounding the Solana ecosystem has turned sharply negative. The prevailing mood is one of capitulation, with many participants signaling that the "top" of the current cycle has passed or that interest has migrated elsewhere. In memecoin trading, when the narrative shifts this aggressively toward the downside, it usually indicates that the "boredom phase" is in full effect.
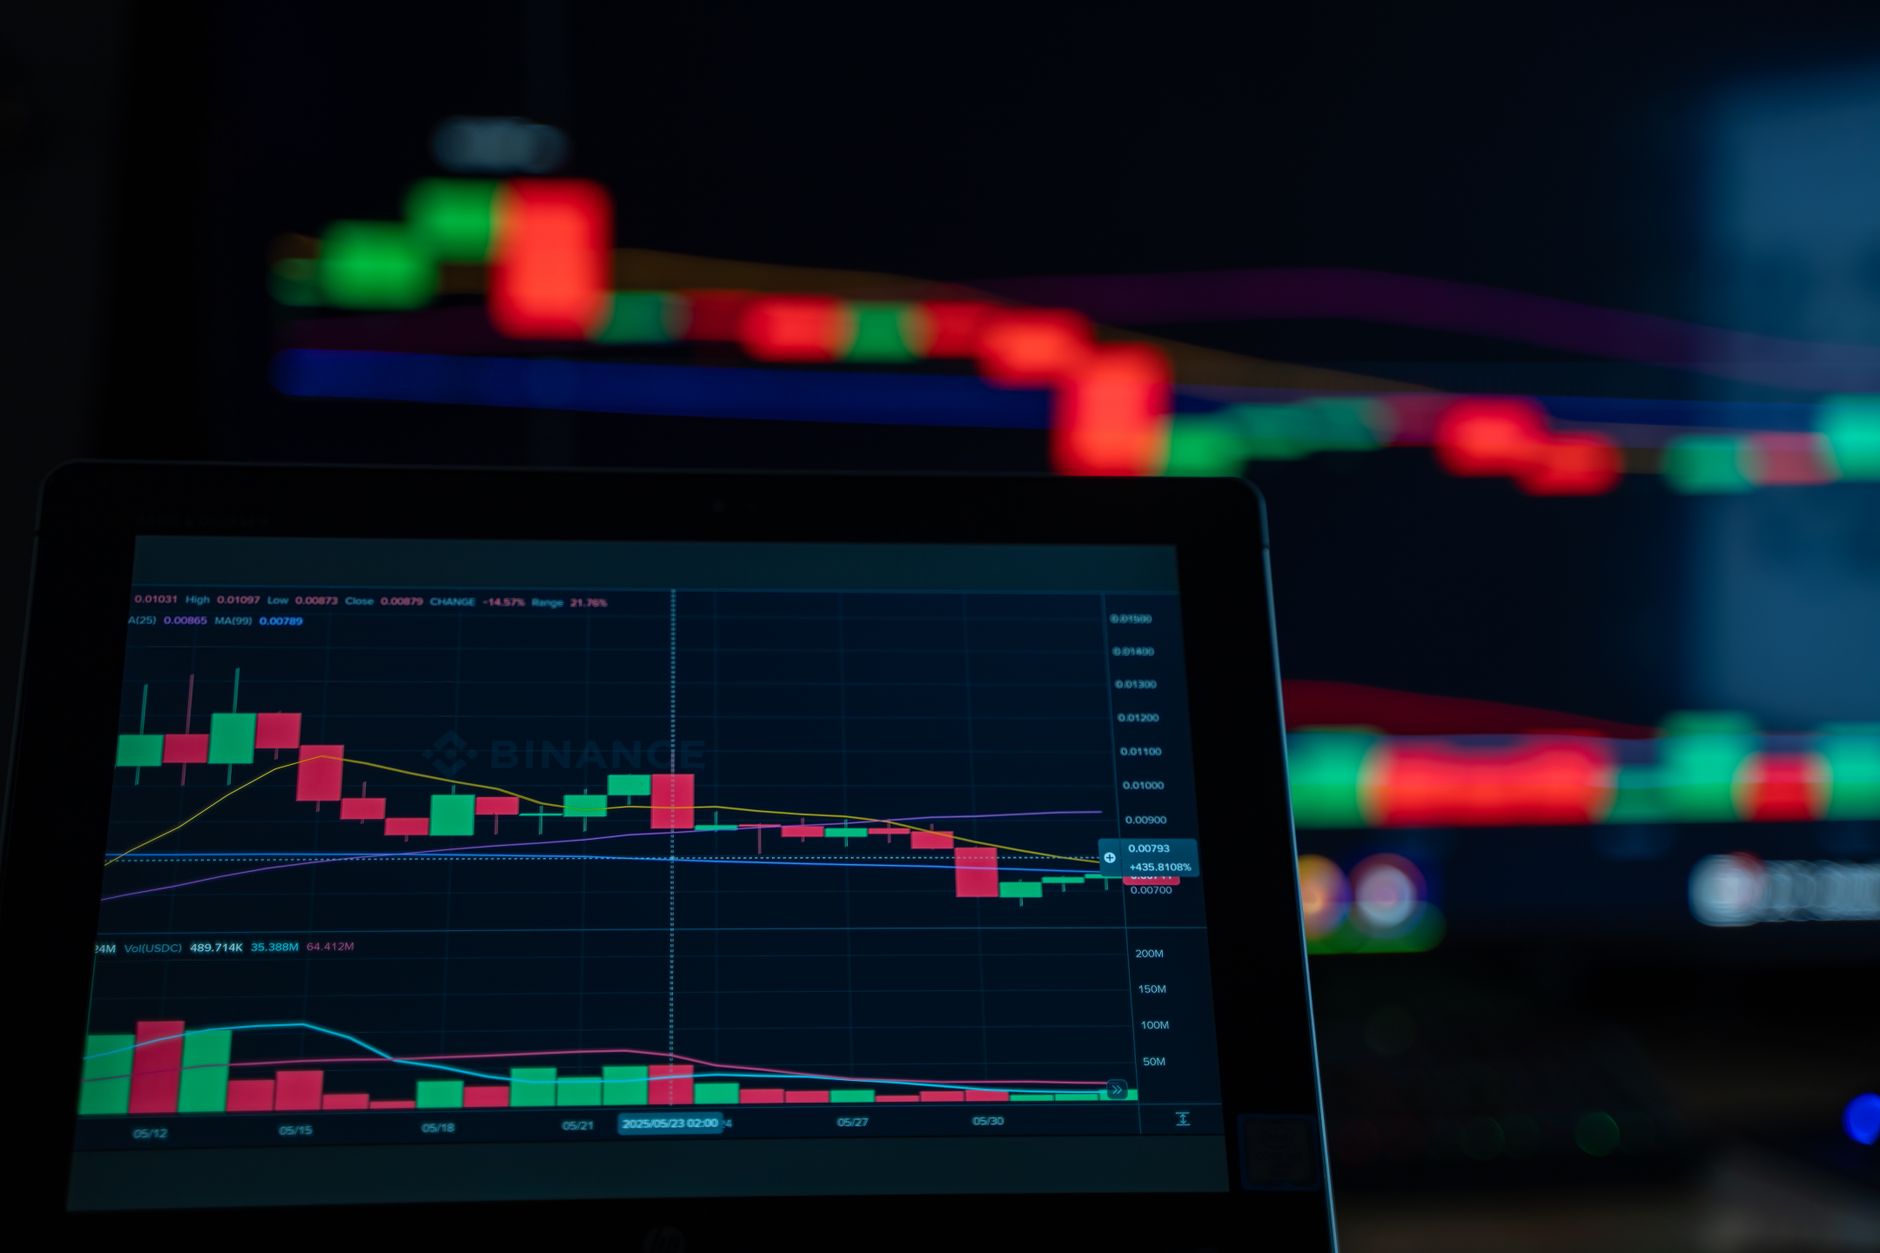
However, narrative trading is notoriously high-risk because attention can reverse within hours. When the heat map turns a deep, saturated red on social platforms, it often reflects a crowded trade of "bears" rather than actual network abandonment. We are seeing the classic signs of emotional fatigue where the loudest voices on the feed are those who have already exited their positions, creating a feedback loop of negativity that may not reflect the broader market reality.
The On-Chain Contradiction
While the social narrative screams bearish, the on-chain data offers a direct counter-argument. We are looking at a system where fundamental utility is actually accelerating. In June 2026, Solana captured 96% of all on-chain tokenized equity trading volume—a historic high that suggests institutional or sophisticated interest is far from disappearing.
Furthermore, active addresses are currently hovering near 7 million, which is a yearly high. If the network were truly dying, as the bearish sentiment suggests, we would see a correlating drop in active addresses and transactions per second. Instead, the seven-day average TPS is trending toward 1,100, pushing against all-time network throughput records. This suggests that the current price action is decoupling from the actual usage of the underlying infrastructure.
Analyzing the Technical Tension
Price action is currently testing the $74–$75 range. This is the defining tension point for the week. Market participants are watching this level closely because it serves as a psychological floor. If the price holds within this $73–$76 band, it provides a signal that the bearish narrative is struggling to push the market into a true collapse. Conversely, a failure to maintain these levels would likely fuel the existing negative sentiment, potentially triggering a cascade of stop-losses.
It is vital to remember that in the memecoin space, volume is the only truth. While social sentiment can be manipulated or reflect the mood of a vocal minority, volume tells us where the capital is actually moving. Currently, trading volume is at yearly lows. This low-volume environment is exactly why the narrative feels so heavy; there is little buying pressure to overcome the negative sentiment, leaving the chart to drift based on the prevailing "vibes" of the day.
FAQ
Why is social sentiment so bearish if network fundamentals are hitting record highs?
Social sentiment is a lagging indicator of price action, not a leading indicator of utility. Participants often conflate their personal portfolio drawdown with the health of the entire ecosystem. Because price has been declining, the narrative has turned negative despite the fact that network throughput and active address counts are at year-to-date peaks.
Should I trade based on the narrative heat map?
Narrative heat maps are tools for understanding market psychology, not for executing entries. Relying solely on the "vibe" of the market is dangerous because narratives can flip in an afternoon. Use the heat map to identify when the market is overly crowded in one direction, and use on-chain metrics to verify if the price move is supported by actual network activity.
Watchlist for Tomorrow
As we head into the next session, we are keeping a close eye on the following:
- The $73–$76 support range: Does it hold under volume pressure or does it break?
- Active address stability: Are we seeing a decline in users, or is the network usage holding steady despite the price action?
- Social sentiment velocity: Watch for a sudden shift in tone. If the "bearish" narrative becomes too consensus-driven, it often marks the point of maximum skepticism, which historically precedes a period of volatility.
Remember, no one knows where the bottom sits. Focus on the data, ignore the noise, and wait for the volume to confirm the next move.
Related posts in Trading Psychology & Journaling
- Trading Psychology & Journaling
MemeLogs: Unpacking Three Mid-Day Market Narratives for July 21, 2026
Analyzing three hot narratives from this morning's crypto markets. We contrast social hype with on-chain reality to keep your trading perspective sharp.
Memelogs
- Trading Psychology & Journaling
Memecoin Liquidity Rotation: Why Solana Volumes Shifted in June 2026
Tracking the shift in Solana liquidity as tokenized assets outpace memecoins. Understand the current volume trends and the state of the 2026 market landscape.
Memelogs
- Trading Psychology & Journaling
MemeLogs Daily Recap: Decoding Market Themes and Volume Trends for 2026
Analyze today's memecoin market themes and volume shifts. Learn how to reconcile social sentiment with on-chain data to sharpen your 2026 trading discipline.