
Solana Market Recap: Analyzing Volume Trends and Psychological Discipline
Solana's current price action and $2.06B volume offer a case study in market sentiment. Learn how to journal your trades to navigate memecoin volatility.

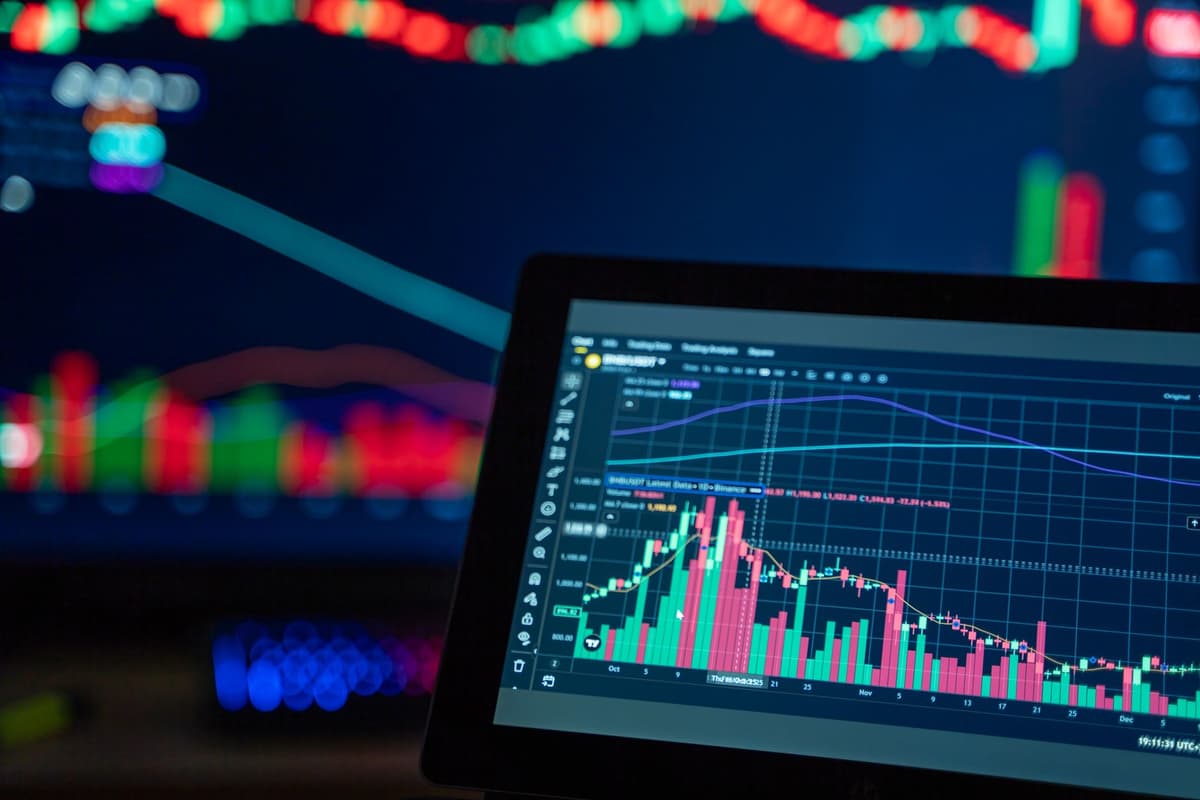
Solana is currently exhibiting a period of consolidation with a modest 1.76% gain, supported by a significant $2.06 billion in daily volume. Market participants should view this as a period of range-bound uncertainty, where maintaining a disciplined trading journal is essential to distinguish between genuine trend shifts and temporary noise.
The Pulse of the Market
Today’s market narrative is defined by a cautious rebound as Solana tests the $77.68 level. While the 1.76% gain suggests a minor recovery from recent weekly lows, the broader context remains one of guarded optimism. The dominant theme across the community is currently split between those looking for a breakout and those bracing for continued range-bound chop.
On-chain data presents a fascinating contradiction to the social sentiment. While social feeds are buzzing with anticipation, the $2.06 billion in daily volume indicates that while liquidity is present, aggressive conviction is lacking. We are seeing a classic "wait and see" approach where large market participants are providing exit liquidity for retail participants without pushing the asset into a clear trend. In the fast-moving world of memecoin speculation, this volume profile often precedes a sharp intraday reversal. If the volume fails to sustain the current price floor, we could see a quick retest of lower support levels.
Why Your Journal is Your Only Edge
The memecoin landscape is inherently predatory. When the market moves sideways, the temptation to over-trade or chase "green candles" is at its highest. This is where the practice of journaling becomes the ultimate survival tool. A journal is not merely a record of your entry and exit points; it is a psychological audit of your decision-making process.
1. Analyze your emotional state
Before you execute a trade, document the specific reason for your entry. Were you following a pre-planned strategy, or were you reacting to the fear of missing out on a trending ticker? If you cannot articulate your logic in one sentence, you are gambling, not participating in the market.
2. Review your losing trades
Professional participants know that losing trades provide more data than winning ones. When you break your own rules—such as ignoring stop-loss levels or sizing too large—you must document the impulse that led to the error. This pattern recognition is what separates those who survive the volatility from those who exit the market permanently.
3. Audit your daily narrative
At the end of each session, compare your initial hypothesis against the actual price action. Did the volume confirm the narrative you expected? If your thesis was wrong, identify the specific data point you missed. This iterative process is the only way to refine your intuition over time.
FAQ
How can I tell if a volume spike is a genuine trend reversal or a trap?
Look for consistency between the price action and the volume increase. A genuine breakout is usually accompanied by sustained, high-volume participation across multiple decentralized exchanges. If you see a massive volume spike followed by a quick wick back to the previous range, it is likely a trap designed to liquidate over-leveraged positions.
Is there a specific way to journal memecoin trades given how fast they move?
Yes, prioritize speed and emotional honesty. Use a simple log to capture the "why" behind the trade immediately after execution. Focus on documenting your state of mind, the ticker, the size, and the outcome. Avoid complex spreadsheets that take too long to update; the goal is to capture the psychological context of the moment before it fades.
Watchlist for Tomorrow
We are looking at the $77.95 intraday high as a critical zone to watch. If volume fails to pick up as the market approaches this level, it may indicate a lack of buying power. Conversely, if volume spikes while the price holds above $76.00, it could signal a shift in momentum. Remember, these are not targets; they are observational markers for your own analysis. Keep your journal open, keep your position sizes manageable, and stay skeptical of any narrative that sounds too good to be true.
Related posts in Trading Psychology & Journaling
- Trading Psychology & Journaling
Overnight Narrative Shifts: Solana Memes and the 2026 Institutional Pivot
Analyzing the shift from legacy Bitcoin narratives to Solana-based memecoin volatility and anti-inflation assets. Watch these trends for tomorrow's session.
Memelogs
- Trading Psychology & Journaling
When Social Hype Diverges from Volume: The 2026 Memecoin Paradox
Analyzing the disconnect between viral social sentiment and on-chain trading activity in the 2026 Solana memecoin market. Learn to spot the signs of exhaustion.
Memelogs
- Trading Psychology & Journaling
2026 Solana Memecoin Rotation: Why Liquidity is Shifting Today
Tracking the 2026 memecoin rotation: How Solana liquidity is moving between viral tokens and launchpads. Stay informed on the latest on-chain market shifts.