
Narrative Heat Map: Solana Sentiment and the 2026 Fear Factor
Analyzing the disconnect between social sentiment and on-chain reality on the Solana network. Learn how to navigate the 2026 market fear and low volume.

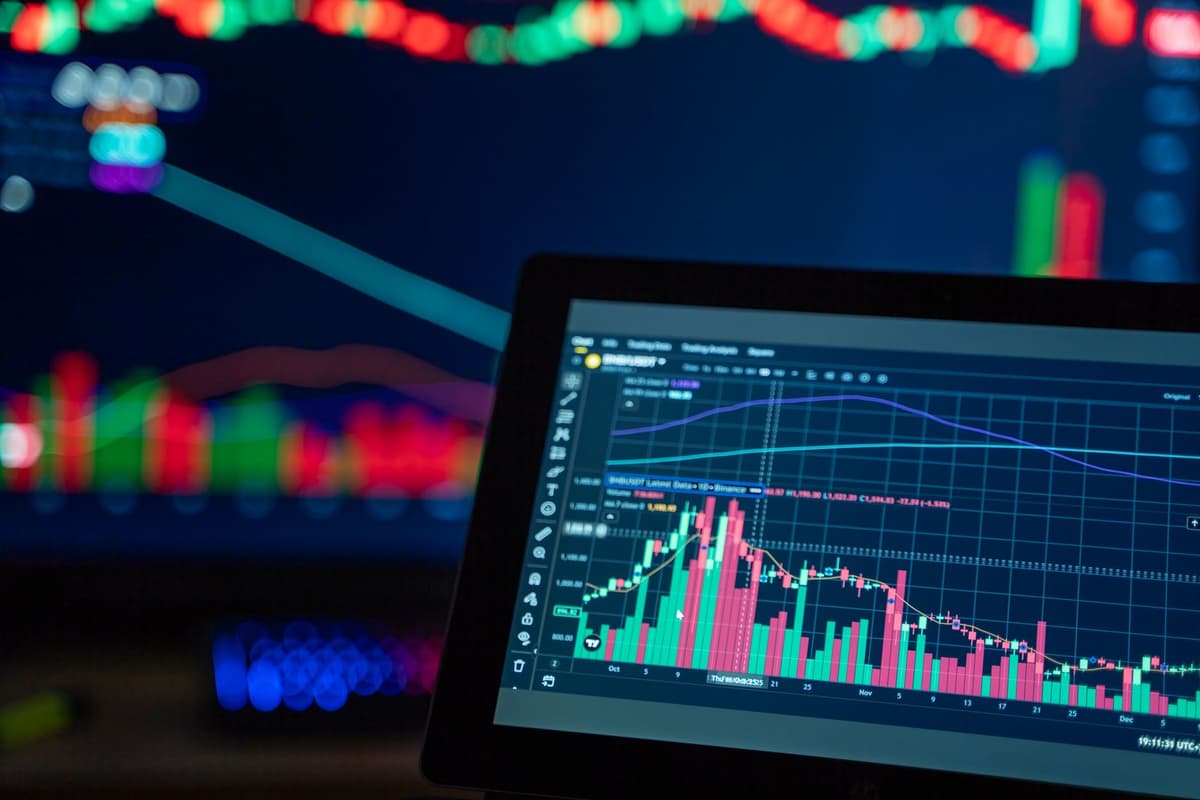
Market sentiment for Solana in 2026 is currently dominated by fear, with an index score hovering around 31. While social discourse remains heavily negative following the lingering impact of the October 2025 liquidations, on-chain volume has hit yearly lows, suggesting a market that is currently paralyzed rather than actively dumping.
The Narrative Landscape: Fear vs.
Reality
Today, the dominant narrative surrounding Solana is one of exhaustion and skepticism. After failing to stage a meaningful year-end rally in December, the retail sentiment has shifted from cautious optimism to outright fear. On social channels, the discourse is saturated with negativity, focusing on the lack of institutional follow-through and the memory of the $20 billion liquidation event that scarred the market in late 2025.
However, the narrative is not monolithic. We are seeing a distinct divergence between the loud, fearful social sentiment and the quiet, stagnant reality of on-chain volume. When volume drops to yearly lows as it has this week, it often indicates that the sellers are exhausted. The market is not necessarily crashing; it is simply waiting for a catalyst that refuses to appear. Skeptics point to the repeated failed rebound attempts as evidence of a structural bear market, while others argue that the current price stagnation is a classic accumulation phase before a potential test of higher psychological levels.
On-Chain Confirmation or Contradiction
When we look at the data, the contradiction is glaring. High social negativity usually correlates with panic selling, yet current on-chain volume metrics tell a story of low participation. This suggests that the majority of participants are either sidelined or holding through the volatility rather than capitulating at current levels.

1. Analyze the Sentiment Divergence
To identify a potential setup, look for instances where social sentiment remains pinned to the bottom 20th percentile while price action refuses to break lower. This divergence often indicates that the market has fully priced in the current negative narrative and is becoming resilient to bad news.
2. Validate Volume Trends
Compare the current low volume against the 30-day average. If volume remains depressed during a price consolidation, it suggests the lack of conviction from the bearish side. Do not mistake low volume for a lack of interest; it is often a sign of market participants sitting on their hands, waiting for a clear signal.
The Psychological Trap
Trading in a fear-dominated environment requires more than just checking price charts. Many participants are falling into the trap of holding positions without a defined exit trigger, hoping for a recovery that aligns with their initial entry bias. This is a remnants of the trauma from the 2025 liquidation events.
It is vital to distinguish between a rational assessment of the market and an emotional response to price stagnation. If your current strategy relies on the hope that "this time it will be different" without a clear, written plan for risk management, you are essentially gambling on sentiment rather than reacting to market structure.
FAQ
Why does high social negativity not always result in a price crash?
High social negativity often reflects the mood of the retail crowd, which is frequently a lagging indicator. When volume is at yearly lows, it suggests that the majority of those who wanted to exit have already done so, leaving only those who are willing to hold through the current uncertainty.
How should a participant handle the current fear-driven market?
Focus on maintaining a strict daily plan and hard loss limits. Because daily narratives can flip within hours, it is safer to prioritize capital preservation over trying to catch a bottom. Use a post-session journal to track your emotional state, specifically noting if your trades are driven by a fear of missing out or a fear of further losses.
Watchlist for Tomorrow
We are not calling for a recovery, but the following areas are worth monitoring as the week progresses:
- Monitor the $73-$76 support range for any signs of institutional defense or further breakdown.
- Observe if social sentiment begins to stabilize even if price action remains flat; this is the first step toward a sentiment shift.
- Keep an eye on overall network volume; a sudden spike in volume without a corresponding price move could indicate the market is preparing for a significant move in either direction.
Related posts in Trading Psychology & Journaling
- Trading Psychology & Journaling
CT Hype vs. On-Chain Reality: The 2026 Solana Narrative Heat Map
Analyzing the disconnect between Solana’s social media hype and actual network utility. Understand why market narratives often deceive today's participants.
Memelogs
- Trading Psychology & Journaling
MemeLogs: When Social Hype Outpaces On-Chain Volume in 2026
Analyzing the widening gap between memecoin social sentiment and actual on-chain volume. Learn how to track liquidity versus chatter in the 2026 market.
Memelogs
- Trading Psychology & Journaling
Volatility 2026: Navigating Overnight Narrative Shifts in Memecoin Markets
Analyze today's dominant memecoin themes versus on-chain data. Learn how to journal volatility and prepare for tomorrow's market shifts without the hype.
Memelogs