
Narrative Heat Map: Decoding Solana On-Chain Volume Trends in 2026
Analyzing the disconnect between social narratives and on-chain liquidity. Use our 2026 framework to track Solana volume shifts and manage your risk…

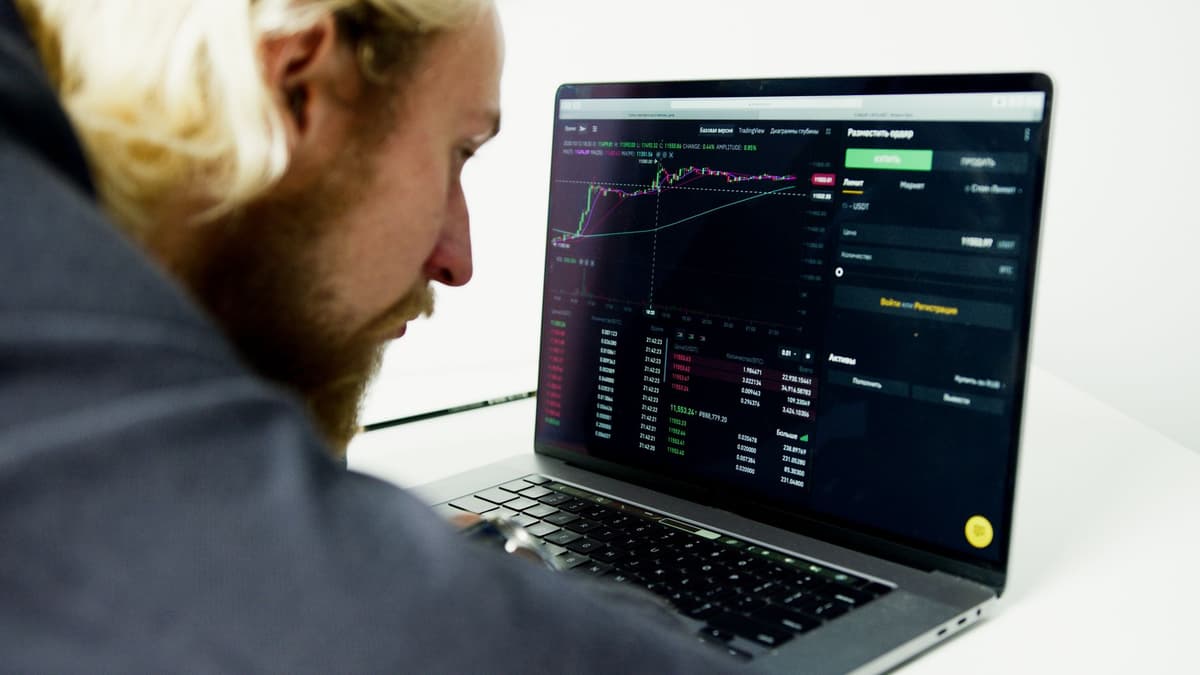
In 2026, the disconnect between social narratives and on-chain volume is the primary driver of market volatility. While retail sentiment often anchors to specific memecoin themes, actual liquidity heatmaps frequently reveal that capital is moving toward defensive positioning rather than high-conviction accumulation.
The Narrative Disconnect
Today’s market is defined by a frantic attempt to find the next "alpha" while the underlying volume data tells a much more sobering story. Social platforms are currently dominated by two themes: the promise of institutional integration for Solana and the persistent, if thinning, speculation surrounding high-velocity memecoin launches.
However, the on-chain reality contradicts the social hype. We have observed a significant contraction in total decentralized exchange volume across the ecosystem compared to earlier in the year. When social sentiment screams "full send" but volume heatmaps show liquidity migrating to stable pools or exiting entirely, the smart money is clearly signaling a flight to safety. Memecoins change intraday; your thesis should be just as fluid.
Visualizing Liquidity and Market Depth
To navigate this environment, you must stop looking at price in isolation and start looking at liquidity depth. Liquidation heatmaps have become the essential tool for 2026, as they visualize the exact price levels where leveraged participants are at risk of being force-closed.
Why Depth Matters More Than Price
- Headline pricing tells you where the market has been, not where it is going.
- Liquidity heatmaps expose the "pain points" where forced buying or selling will likely trigger a cascade.
- Understanding the difference between estimated volume and real-time, on-chain position data is the difference between catching a move and becoming the exit liquidity.
The Psychology of the 2026 Retail Participant
Market participants are currently exhibiting signs of extreme caution. The massive decline in DEX activity over the last few weeks suggests that the retail base is exhausted. When you see a high-volume spike on a new token, ask yourself: is this organic interest, or is this a localized liquidity trap designed to hunt stops?
If you are relying solely on social media sentiment to guide your entries, you are likely trading the ghosts of a narrative that has already been priced out. The most successful market participants in 2026 are those who use volume heatmaps to validate whether a breakout is backed by genuine capital flows or merely inflated by bots and thin order books.

FAQ
Is it better to follow social media trends or on-chain data?
Social media trends provide the "what," but on-chain data provides the "truth." Relying on social sentiment alone often leads to participating in liquidity traps, whereas checking volume depth allows you to confirm if a trend has the institutional or retail backing required for a sustained move.
How can I effectively use a liquidation heatmap for my daily routine?
Use the heatmap to identify clusters of leveraged positions. If price approaches a zone with high liquidation exposure, expect increased volatility as those positions are either defended or flushed. Avoid entering trades directly into these high-pressure zones unless you have a clear plan for the resulting spike in activity.
Watchlist for Tomorrow
We are shifting our focus away from the high-noise, low-volume assets that dominated the morning session. Instead, monitor the following areas for tomorrow’s session:
- Liquidity concentration levels on major Solana pairs: Watch for shifts in the heat map that suggest institutional re-balancing.
- Volume divergence: If social engagement remains high for a specific token but on-chain volume continues to trend downward, consider this a primary warning sign of a narrative reversal.
- Stability in the broader market: Observe whether the current contraction in DEX volume stabilizes or continues its downward trajectory, as this will dictate the risk appetite for the remainder of the week.
Remember, in the current market environment, the best trade is often the one you do not take. Protect your capital, watch the depth, and stay skeptical of every "guaranteed" narrative.
Related posts in Trading Psychology & Journaling
- Trading Psychology & Journaling
Overnight Narrative Shifts: Tracking Solana Volatility and 2026 Market Dynamics
Analyzing the overnight narrative shifts in memecoin markets. We break down Solana whale activity, ZKP anti-inflation design, and how to watch for tomorrow.
Memelogs
- Trading Psychology & Journaling
Narrative Heat Map: Solana Sentiment and the 2026 Fear Factor
Analyzing the disconnect between social sentiment and on-chain reality on the Solana network. Learn how to navigate the 2026 market fear and low volume.
Memelogs
- Trading Psychology & Journaling
CT Hype vs. On-Chain Reality: The 2026 Solana Narrative Heat Map
Analyzing the disconnect between Solana’s social media hype and actual network utility. Understand why market narratives often deceive today's participants.