
On-Chain Whale Tracking: Identifying Accumulation Patterns in 2026
Master the architecture of on-chain analysis. Learn how to spot whale accumulation patterns before market narratives shift using Solana ecosystem data.

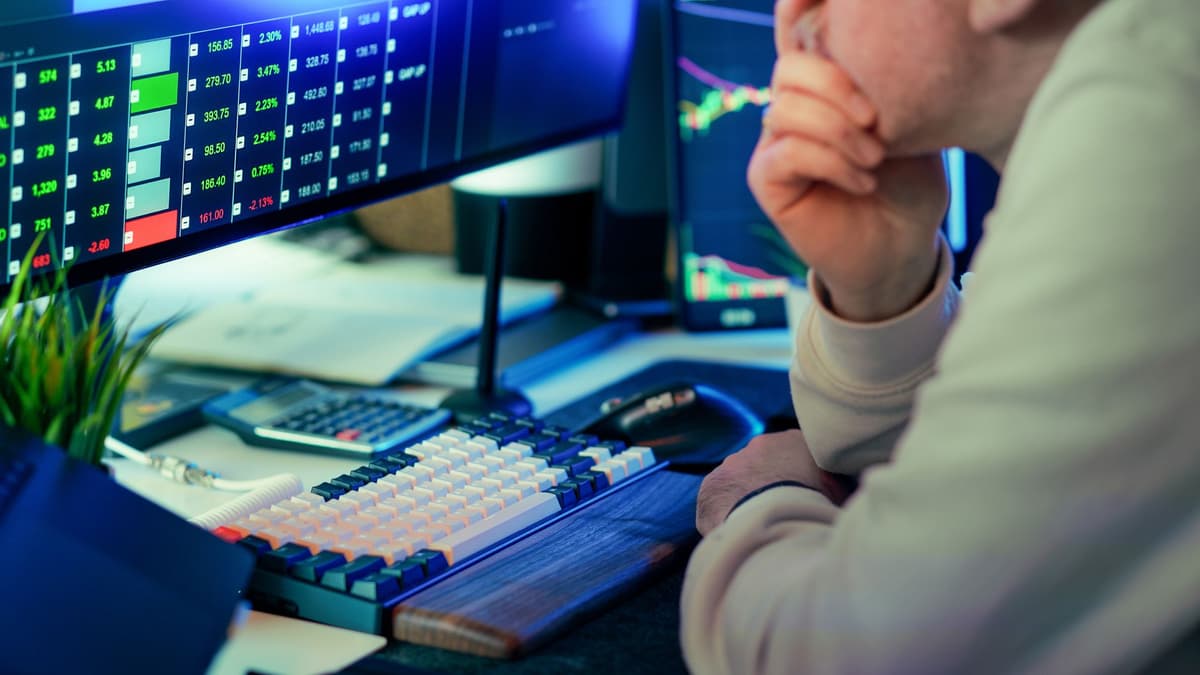
Whale accumulation is identified by observing large, sustained buy orders from non-exchange wallets that persist despite overall negative price action. By monitoring wallet clustering and liquidity depth on-chain, market participants can detect institutional positioning before a broader narrative gains retail momentum.
Understanding the Whale Footprint
In the current market cycle of 2026, the primary indicator of long-term confidence is not social sentiment, but on-chain flow. When large wallets continue to increase their positions in assets like Solana despite significant price corrections, it suggests a disconnect between short-term retail panic and long-term institutional conviction. Whales often utilize periods of high volatility to accumulate supply at lower cost bases, effectively absorbing the sell pressure from hesitant market participants.
The Mechanics of Accumulation
Accumulation is rarely a single transaction. It is a systematic process of acquiring assets over weeks or months to avoid slippage. To track this, you must look beyond the daily price chart and focus on the wallet behavior of top holders. When top-tier addresses consistently add to their holdings while the circulating supply remains stagnant or decreases in availability, it signals a tightening of the float.
1. Analyze Top Holder Net Flow
Use a block explorer to examine the top 50 to 100 wallets for a specific asset. You are looking for a net positive change in balance over a 30-day period. Ignore exchange-labeled wallets, as these represent aggregate retail traffic rather than individual conviction.
2. Identify Wallet Clustering
Whales often split their capital across multiple smaller wallets to obscure their total position size. Look for clusters of wallets that were funded from the same source or that interact with the same smart contracts simultaneously. If ten distinct wallets all purchase the same asset within a short time window, you are likely looking at a single entity or institutional desk.
3. Monitor LP Migration
Check the liquidity provider (LP) positions associated with these wallets. Whales frequently move assets into decentralized liquidity pools to earn yield while they wait for a narrative to heat up. If you see large liquidity injections into pools during a price dip, it indicates that the capital is intended to stay in the ecosystem for the long term.
4. Evaluate Volume vs.
Price Divergence
If an asset price remains flat or trends downward while on-chain volume remains elevated, this is a classic sign of accumulation. The volume indicates that assets are changing hands, but the lack of price appreciation suggests that the buying pressure is being met by structured selling from retail, which the whales are happy to absorb.
FAQ
Does a single large wallet movement indicate a market reversal?
No. A single transaction is often just a portfolio rebalance or a transfer between internal accounts. True accumulation is characterized by a series of consistent, repetitive buy orders across multiple wallets over an extended timeframe.
Why does whale accumulation often happen during price drops?
Whales aim to acquire the largest possible position with the least amount of slippage. A price drop provides the necessary liquidity for them to enter large positions without driving the price up prematurely, which would make their subsequent accumulation more expensive.
| Indicator | Bullish Signal | Bearish Signal |
|---|---|---|
| Top 100 Wallets | Net Accumulation | Net Distribution |
| LP Liquidity | Increasing | Draining |
| On-Chain Volume | Elevated / Flat Price | High / Falling Price |
What this is NOT
This analysis is not financial advice. It is not a buy signal. It is not a guaranteed method for predicting price movements. Always conduct your own research regarding the risks of volatile digital assets.
Conclusion
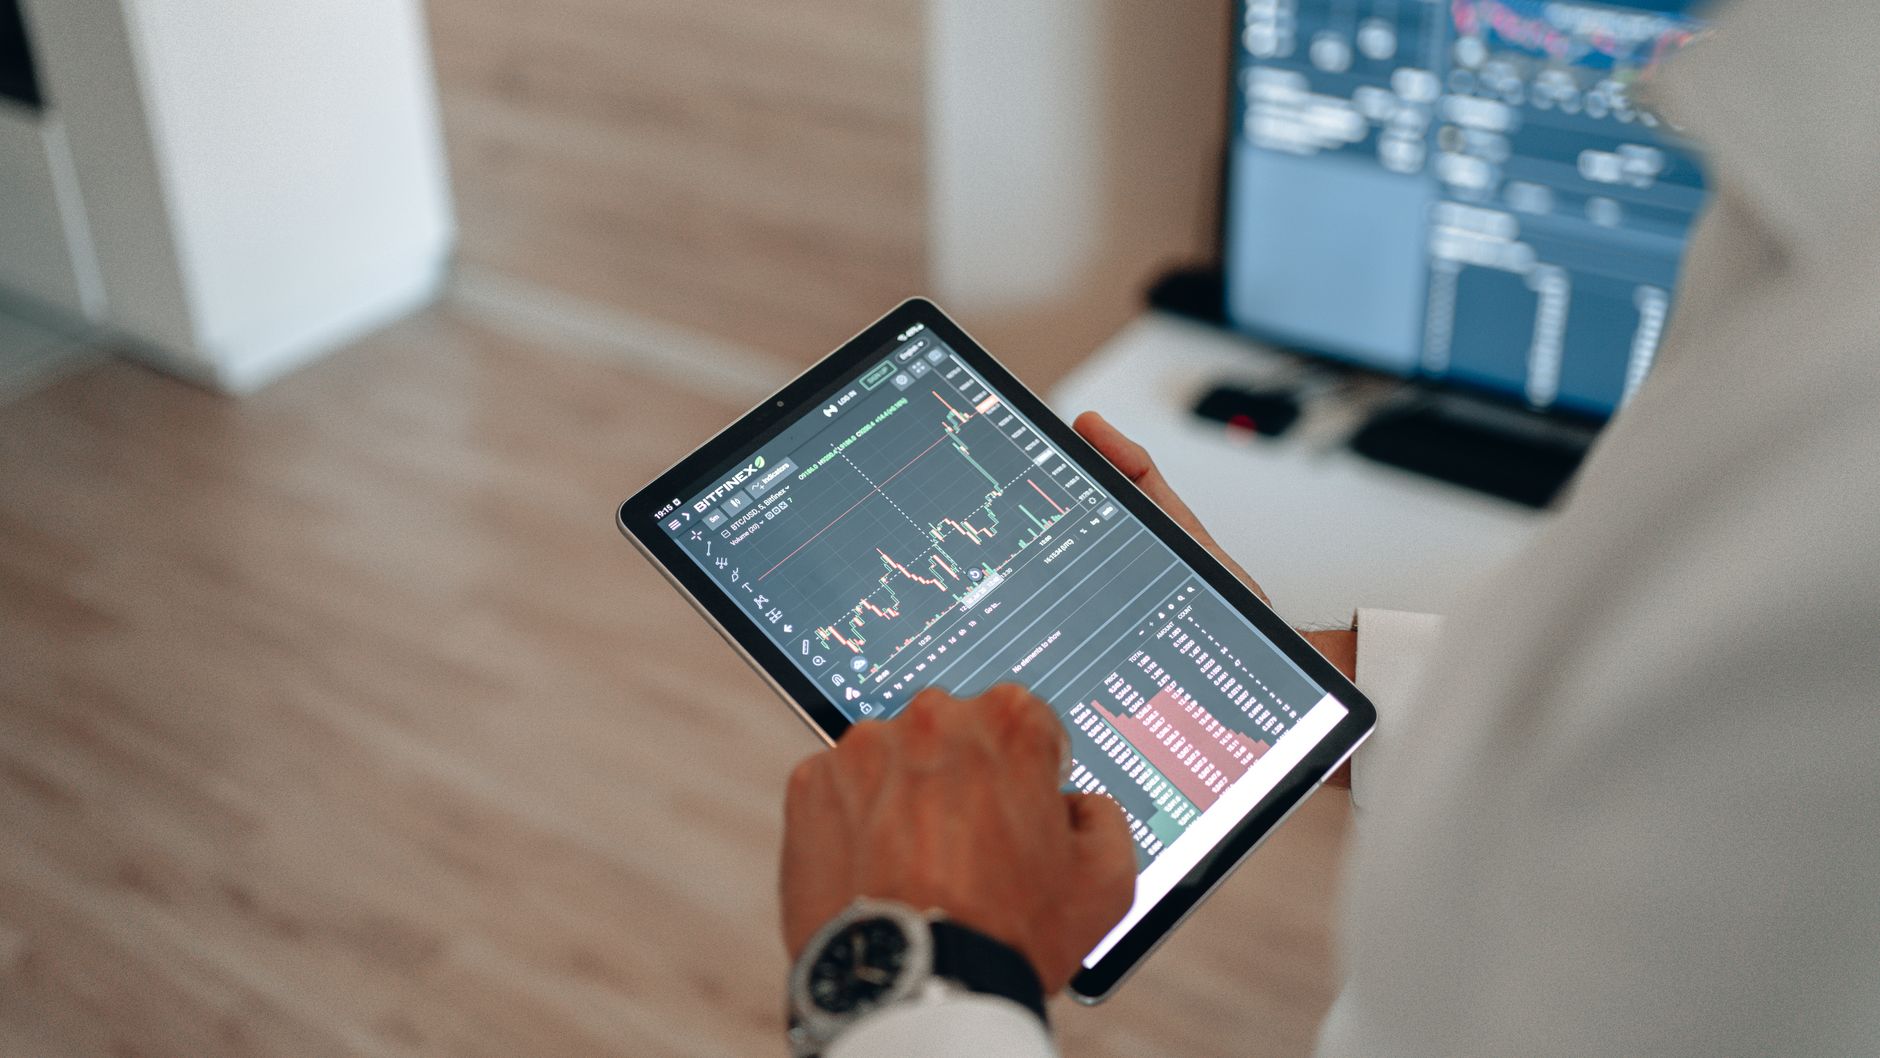
Tracking whale activity is about reading the architecture of the market rather than predicting the next move. By focusing on wallet clusters, net flow, and liquidity depth, you can observe where the smart money is positioning itself. In 2026, the most successful market participants are those who treat the blockchain as a transparent database, prioritizing raw data over market noise.
Related posts in On-Chain & Whale Tracking
- On-Chain & Whale Tracking
Tracking Smart Money Wallets on Solana for Memecoin Strategies in 2026
Master the technical workflow for monitoring high-signal wallets on Solana. Learn to filter on-chain data, track liquidity, and analyze whale movements in 2026.
Memelogs
- On-Chain & Whale Tracking
On-Chain Red Flags: Spotting Solana Rug Pulls in 2026
Learn to identify early warning signs of Solana token rug pulls. Master on-chain analysis to protect your capital from liquidity drainage and malicious…
Memelogs
- On-Chain & Whale Tracking
Mastering Bonding Curve Metrics: Analyzing Solana Memecoin Launches in 2026
Learn to interpret bonding curve metrics on Solana. Understand how pricing formulas work and track whale activity to identify potential volatility shifts.
Memelogs