
Mastering Bonding Curve Metrics: Analyzing Solana Memecoin Launches in 2026
Learn to interpret bonding curve metrics on Solana. Understand how pricing formulas work and track whale activity to identify potential volatility shifts.

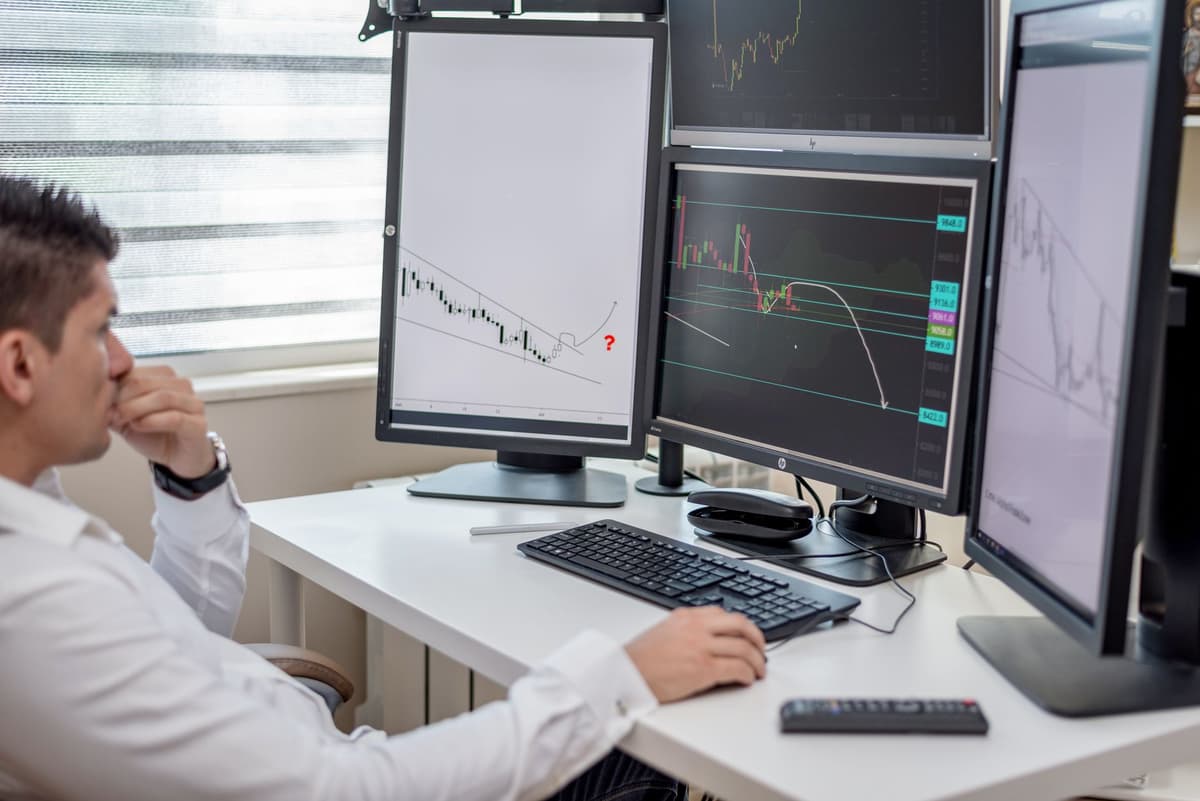
Bonding curve metrics determine a token's price based on the ratio of supply purchased, creating an automated pricing model that removes the need for traditional order books. By tracking the percentage of the curve filled and monitoring wallet clustering via on-chain explorers, participants can identify when a token is approaching a migration threshold or liquidity saturation point.
Understanding the Bonding Curve Mechanism
A bonding curve is a mathematical formula that dictates a token’s price automatically based on its circulating supply. As market participants buy more of the token, the price increases along a predetermined curve. Conversely, selling decreases the price. This mechanic is the backbone of modern memecoin launches on platforms like Pump.fun, which have seen massive volume spikes in 2026.
Unlike traditional exchanges that rely on matching buy and sell orders, bonding curves provide instant liquidity. The primary metric to watch is the 'curve completion percentage.' This represents how much of the bonding curve has been filled before the token migrates to a decentralized exchange (DEX). When this threshold is hit, the token typically transitions from a bonding curve model to a standard liquidity pool, which often leads to significant volatility.
How to Read On-Chain Metrics Before a Move
1. Analyze the Curve Fill Percentage
Check the progress bar or the numerical fill percentage on the token’s launch page. A curve that is 80% to 90% full indicates that the token is approaching a liquidity migration. This often triggers a flurry of activity as market participants attempt to front-run the transition to a DEX.
2. Monitor Wallet Clustering
Use a block explorer to examine the top 10 holders. Look for 'wallet clusters'—a series of wallets created at the same time that hold similar amounts of the token. If the top holders are highly concentrated, the bonding curve price may be artificially inflated. High concentration increases the risk of a sudden sell-off once the token migrates.
3. Evaluate Liquidity Quality
Check if the liquidity is locked or if it is being drained by early participants. A healthy bonding curve should show consistent buy volume rather than a single massive buy followed by silence. Use an on-chain scanner to track the inflow of SOL against the output of the memecoin.
4. Observe Volume Trends
Compare the daily volume against the total supply bought. If the volume is rising but the price is barely moving along the curve, it suggests that there is heavy sell pressure offsetting the buy pressure. If the price moves aggressively with low volume, the curve is thin and highly susceptible to volatility.
Comparative Metrics for Solana Memecoins
| Metric | Significance | Indicator of Health |
|---|---|---|
| Curve Fill % | Migration proximity | 90%+ (approaching maturity) |
| Top 10 Holder % | Concentration risk | < 20% (distributed) |
| Buy/Sell Ratio | Momentum | > 1.5 (buying pressure) |
| Wallet Age | Participant maturity | Diverse age (organic growth) |
The Role of Sentiment and Volume
In 2026, memecoin trading on Solana has been driven by viral narratives, such as the recent interest in penguin-themed tokens. While the bonding curve provides the technical framework for pricing, the actual movement is fueled by volume. High volume indicates that a token has captured community attention. Participants should look for a correlation between rising social sentiment and an increase in the bonding curve fill rate. When these two factors align, the probability of reaching the migration threshold increases.
FAQ
Does a high bonding curve percentage guarantee a successful launch?
No. A high fill percentage only indicates that the token is nearing the migration threshold. It does not guarantee that the token will maintain its value or liquidity once it hits a decentralized exchange, where market forces replace the automated pricing formula.
How can I tell if a token is being manipulated?
Look for wallet clusters and repetitive, small-value transactions that inflate volume without significantly moving the price. If the top holders are all interacting with the same smart contract or were funded by the same origin wallet, it is a strong indicator of artificial activity rather than organic community demand.
What this is NOT
This content is for informational purposes only and does not constitute financial advice. Analyzing on-chain data is not a guaranteed method for profit, and market participants should perform their own research before engaging with any memecoin. There are no buy signals or guaranteed returns in this analysis.
Related posts in On-Chain & Whale Tracking
- On-Chain & Whale Tracking
On-Chain Red Flags: Spotting Solana Rug Pulls in 2026
Learn to identify early warning signs of Solana token rug pulls. Master on-chain analysis to protect your capital from liquidity drainage and malicious…
Memelogs
- On-Chain & Whale Tracking
Tracking Smart Money Wallets on Solana: A 2026 Architectural Approach
Learn the technical framework for monitoring high-signal wallets on Solana. Master on-chain data analysis to identify liquidity flows and market activity.
Memelogs
- On-Chain & Whale Tracking
Memecoin Playbook 2026: Analyzing Wallets, Liquidity, and Concentration
Master the 2026 Solana memecoin market by auditing liquidity, tracking smart money wallets, and assessing holder concentration to identify on-chain patterns.
Memelogs