
Solana Volume 2026: Three Narratives Tested Against On-Chain Reality
Solana trading volume hit $7 billion, outperforming major exchanges. We analyze three market narratives against on-chain reality for a clear view of the day.

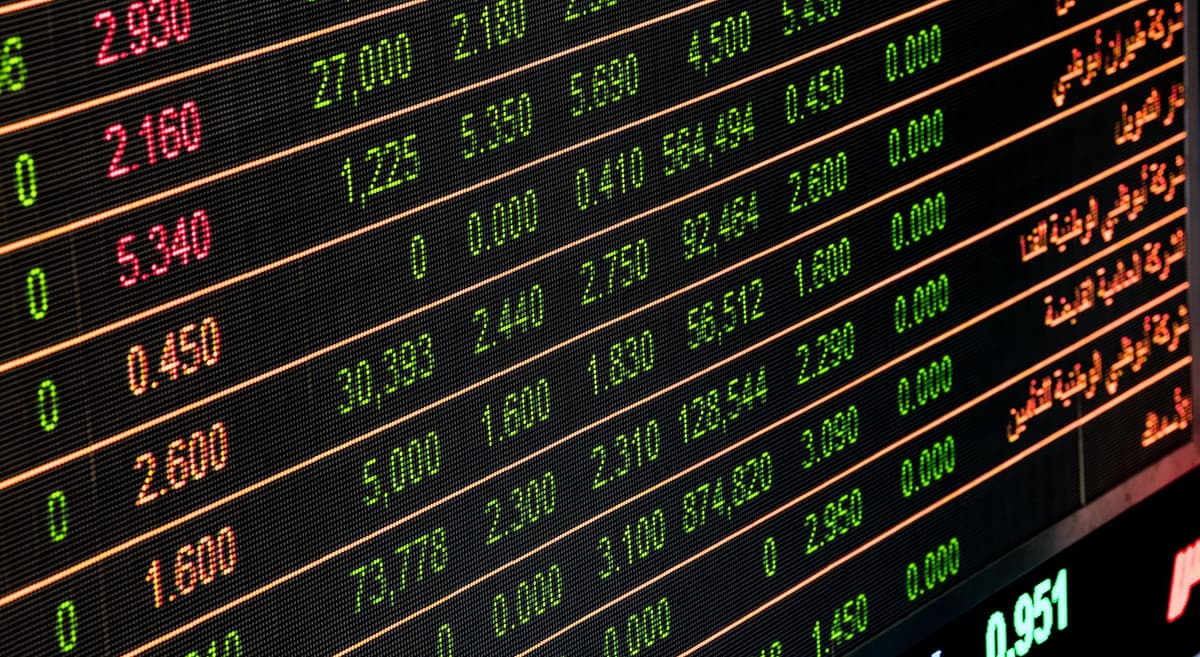
Today's market activity confirms that Solana is currently capturing significant spot volume, frequently outpacing major centralized exchanges like Coinbase and Kraken. While social sentiment often hypes specific micro-narratives, the on-chain data shows that total network throughput and developer momentum remain the primary drivers of this sustained volume surge rather than isolated memecoin hype cycles.
The Morning Narrative vs.
The On-Chain Reality
This morning, the market was buzzing with three distinct narratives: the "flippening" of centralized exchange volume, the institutional accumulation phase, and the perceived exhaustion of the current memecoin cycle. By the time the markets closed, the chain told a more nuanced story.
1. The CEX Flippening Narrative
The most aggressive narrative this morning was that decentralized activity on Solana had finally cannibalized the liquidity of major centralized exchanges. Social channels were flooded with charts comparing Solana's daily volume to established platforms like Coinbase and Kraken.
- On-chain reality: The volume is indeed there. With daily figures crossing $7 billion, the network is processing a scale of activity that is objectively impressive. However, volume is not synonymous with value retention. The chain shows high velocity but also indicates that a significant portion of this activity is reflexive—driven by rapid-fire cycles that look busy but capture less direct economic value for the long-term holders than the raw numbers suggest.
2. The Institutional Accumulation Narrative
Another dominant theme was the idea that institutions are quietly accumulating at these price levels, specifically targeting the $30+ range as a floor.
- On-chain reality: While the developer activity and institutional access metrics are objectively strong, the blockchain data does not explicitly confirm a coordinated "institutional buy-wall" at any specific price point. Instead, the data shows a deep, highly active ecosystem where developer momentum is the true anchor. The belief that institutional entry is driving current spot prices to their current levels is largely speculative, as the chain reflects broader network utility rather than discrete, identifiable institutional wallet footprints.
3. The Memecoin Cycle Exhaustion Narrative
By midday, the prevailing sentiment shifted toward the exhaustion of memecoin liquidity. Many market participants argued that the lack of new "viral" assets meant the broader ecosystem was cooling down.
- On-chain reality: The volume metrics contradict the idea of a total cooldown. Despite the lack of a singular, dominant meme trend today, the aggregate spot trading volume remained elevated. This suggests that liquidity is moving between assets rather than exiting the ecosystem entirely. The chain shows that users are not leaving; they are rotating, which is a hallmark of a mature, high-volume environment rather than a dying one.
Navigating the Noise
Memecoin markets are notorious for their intraday volatility. What looks like a structural shift at 10:00 AM can look like a temporary anomaly by 4:00 PM. The key takeaway for today is that while narratives provide the emotional context for the market, the on-chain volume provides the necessary reality check.
FAQ
Is the current $7 billion volume spike sustainable for the ecosystem long-term?
While the current volume is a testament to the network's capacity and developer activity, volume alone does not guarantee long-term stability. The chain shows that high throughput is a necessary condition for success, but future health depends on whether this volume translates into long-term economic value rather than just high-frequency speculation.
Does the data suggest a specific price floor for assets on the network?
No. The on-chain data tracks activity and volume, not price support levels. While the network has demonstrated resilience, there is no technical evidence in the current on-chain metrics that guarantees a floor or prevents volatility in the underlying assets.
Watchlist for Tomorrow
Instead of chasing the morning's loudest narratives, keep an eye on these indicators as the next cycle begins:
- Monitor the ratio of stablecoin movement versus native asset movement to see if liquidity is actually leaving or just rotating.
- Observe developer deployment frequency; a drop in new contract creation often precedes a drop in retail volume.
- Watch for shifts in the top 10 most active tokens by volume to identify if the market is concentrating on a few "blue-chip" memes or spreading risk across the board.
Remember, in this environment, skepticism is your best risk-management tool. If a narrative feels too loud, check the chain to see if the volume is actually following the noise.
Related posts in Trading Psychology & Journaling
- Trading Psychology & Journaling
MemeLogs: Navigating Overnight Narrative Shifts in 2026 Crypto Markets
Analyze today's dominant memecoin narratives against on-chain volume. Learn how to track overnight shifts and refine your trading psychology for the 2026…
Memelogs
- Trading Psychology & Journaling
Memecoin Market Divergence: When Social Hype Outpaces On-Chain Volume in 2026
Analyzing the disconnect between social sentiment and on-chain volume in the 2026 Solana memecoin cycle. Learn to spot the signs of exhaustion.
Memelogs
- Trading Psychology & Journaling
Solana Memecoin Trends 2026: Navigating the High-Volatility Landscape
Tracking the latest shifts in Solana memecoin sentiment for 2026. We break down the decoupling between social hype and on-chain volume for today's market.