
Solana 2026 Liquidity Rotation: Decoding Today's Market Shifts
Analyzing today's Solana liquidity rotation. We break down the $12 billion volume surge and what the current stability near $73 means for your strategy.

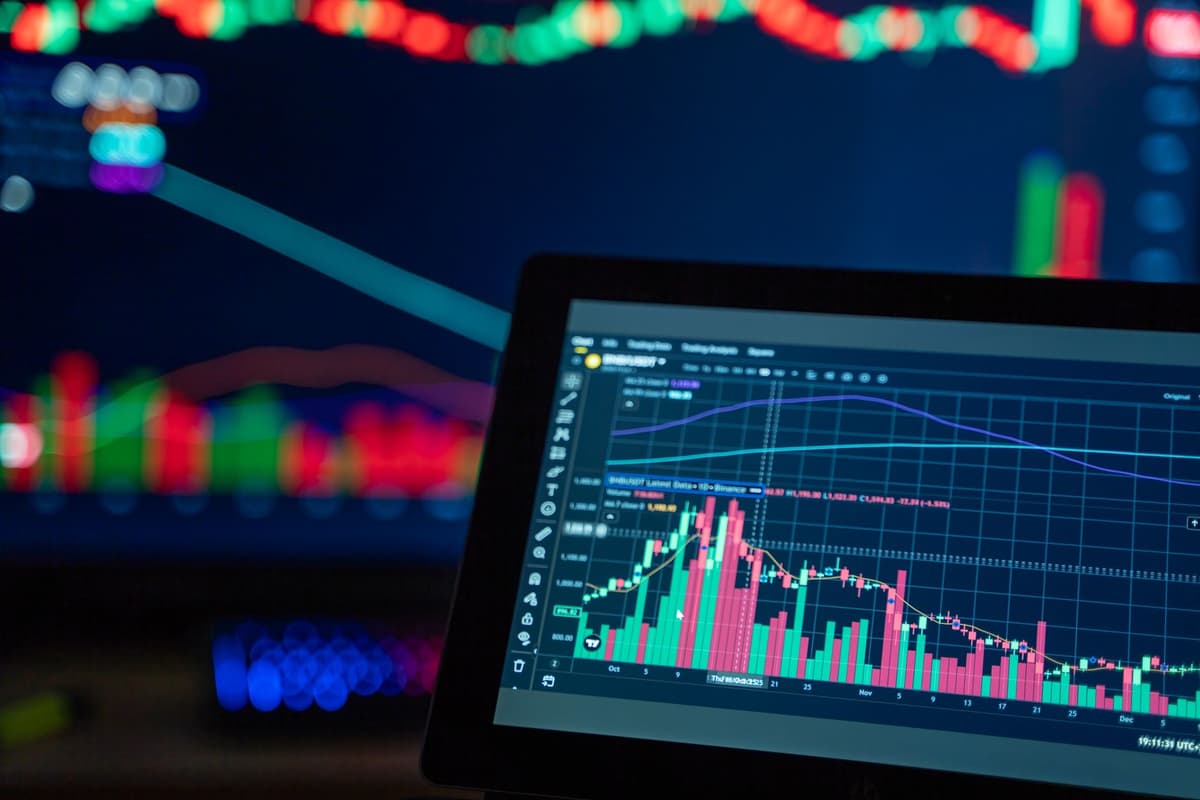
Solana liquidity remains robust today with a score of 80.9, supporting orderly market transitions despite ongoing price consolidation. While trading volume jumped 11% to $12 billion, the market is currently caught in a tug-of-war between high activity and a cautious price floor near $73.
The Narrative vs.
The Reality
Today in the trenches, the sentiment on Solana is characterized by a strange duality. On one hand, the "ecosystem is back" narrative is gaining traction, fueled by a clear 11% uptick in daily trading volume, now sitting at $12 billion. Retail participants are pointing to this as evidence that the dry spell is over and that liquidity is rotating back into high-beta assets.
However, the on-chain reality forces a more skeptical view. While volume is up, the price action remains stubbornly tethered to the $73 level. In the world of memecoin speculation, volume without a sustained breakout is often just churning—participants swapping the same bags back and forth while waiting for a catalyst that refuses to materialize. The liquidity score of 80.9 confirms that the market is deep enough to handle selloffs without a total collapse, but it also suggests that the current "rotation" might simply be a redistribution of existing capital rather than an influx of fresh, conviction-based money.
Why the $73 Level Matters
Market participants are currently obsessing over the $73 handle, and for good reason. From a technical perspective, this price point aligns with specific retracement levels that institutional and retail participants alike are watching closely. The skepticism here is warranted: when volume rises but price stays flat or drifts lower, it usually indicates that buyers are absorbing supply at a fixed rate, but are unwilling to push for higher ground.
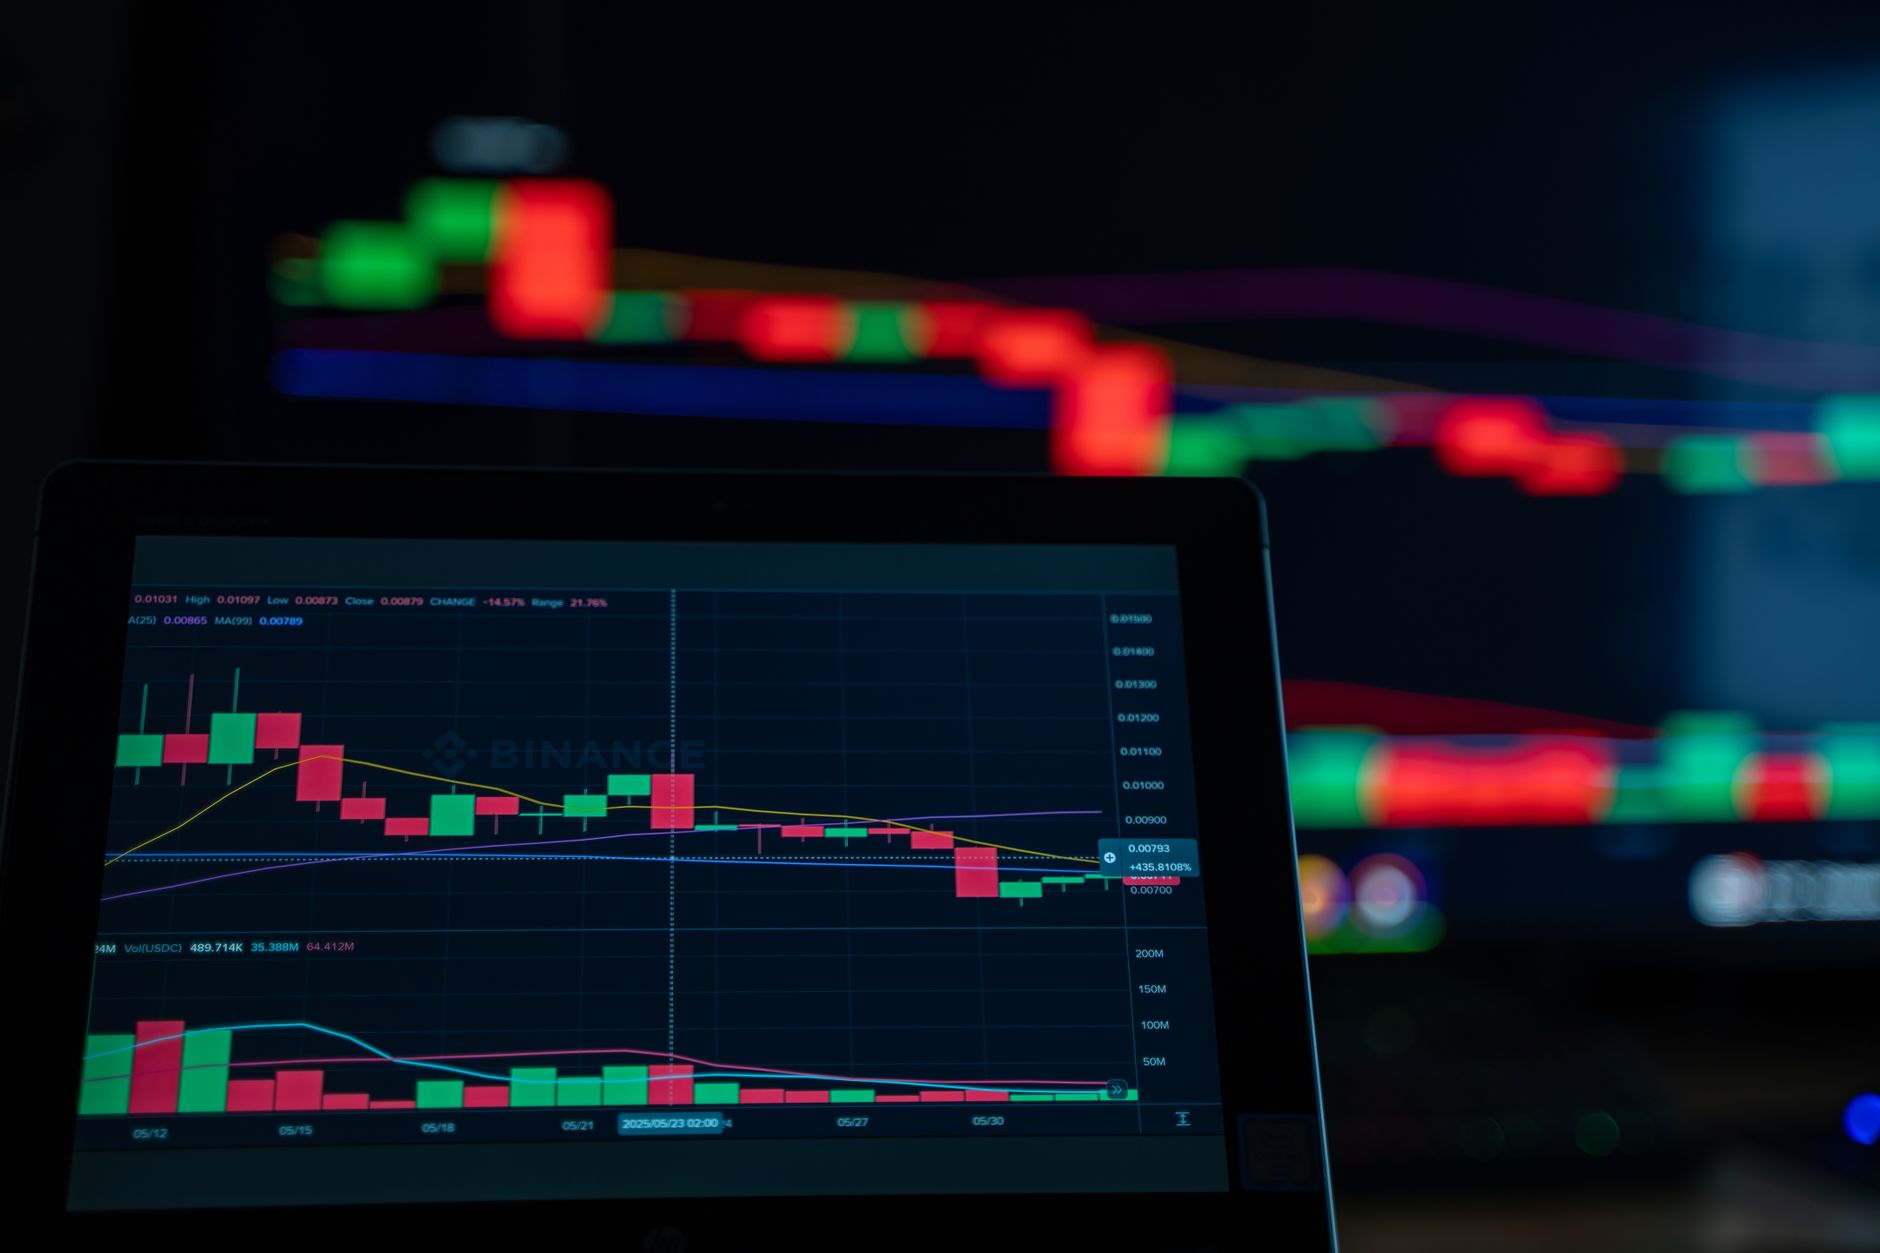
If you are watching the order books, you will notice that liquidity is not necessarily "rotating" into new, explosive narratives as much as it is rotating into "safe-haven" memecoins that have already established a floor. The frenzy for new launches has cooled, replaced by a preference for established tickers that offer higher exit liquidity.
The Cautionary Tale of 2026
We have seen this movie before in 2026. Earlier months showed us that historical seasonal averages can be completely ignored when macro sentiment turns sour. February, for example, failed to live up to its typical performance, and the current state of Solana suggests that we are in a "prove it" phase. The market is not rewarding optimism; it is rewarding those who recognize that liquidity is fleeting and can reverse within a few hours of an unexpected macro print or a shift in sentiment on social platforms.
FAQ
What does a liquidity score of 80.9 signify for my daily trades?
It indicates a high capacity for the market to absorb orders without massive slippage. It essentially means that while the market is volatile, it is currently orderly, allowing for cleaner entries and exits compared to low-liquidity environments.
Is the 11% volume increase a signal to go long?
No. An increase in volume simply confirms that more assets are changing hands. It does not dictate direction. Given that the price remains stagnant near $73 despite this volume, it is safer to view this as a period of accumulation or distribution rather than a confirmed trend reversal.
Watchlist for Tomorrow
As we look ahead to the next session, do not fall for the trap of chasing high-volume tickers that have failed to break their local resistance. Instead, keep your focus on:
- Volume sustainability: If the $12 billion volume starts to bleed off, the $73 support level will likely face its most significant test yet.
- The stability of existing memecoin leaders: Watch if the liquidity stays concentrated in the top-tier assets or if it begins to bleed out into speculative low-caps, which would signal a shift in risk appetite.
- Macro responsiveness: Monitor how the market reacts to the first hour of trading, as that often sets the tone for whether the liquidity rotation is genuine or merely a temporary fluctuation.
Related posts in Trading Psychology & Journaling
- Trading Psychology & Journaling
Narrative Heat Map: Decoding Solana On-Chain Volume Trends in 2026
Tracking the disconnect between social media hype and on-chain reality. Analyze 2026 Solana volume, institutional shifts, and tokenized asset activity today.
Memelogs
- Trading Psychology & Journaling
MemeLogs: When Social Hype Diverges from Volume in 2026 Memecoin Markets
In 2026, memecoin trading shows stark divergence between social hype and on-chain volume. Learn how to navigate Solana's liquidity shifts and viral trends.
Memelogs
- Trading Psychology & Journaling
Solana Narrative Shifts: Navigating the 2026 Landscape and Market Psychology
Analyzing the latest Solana narrative shifts and on-chain activity for 2026. Learn how to refine your market psychology and strategy for volatile conditions.